Aura Living
eCommerce Dashboard Design & Frontend Development
A custom dashboard that replaces messy spreadsheets with live sales and marketing numbers for clear daily tracking.
The Problem
The company relied on separate spreadsheets with conflicting formulas and slow load times. Finding reliable numbers wasted hours every week.
Before
- •Messy Spreadsheets: Sales and ad numbers lived in separate files.
- •Formula Errors: Conflicting sheets showed different revenue totals.
- •Slow Decisions: Finding reliable numbers took hours every morning.
Goals
- •Single Source of Truth: Put all core numbers in one clean dashboard.
- •Focused Screens: Dedicated views for sales, checkout funnels, and products.
- •Fast Loading: Instant filters and responsive charts on every device.
Requirements
Interviews across leadership, marketing, and operations shaped the dashboard around key requirements:
Store Leadership
Sales Growth & Profit Margins
"Are we pacing ahead of last month, and what is our real profit after returns?"
High-level overview with revenue pacing, order volume, and margin health.
Marketing Team
Ad Channels & Conversion Funnels
"Where do buyers drop off, and which channels bring the most profitable orders?"
Step-by-step funnel drop-offs and marketing channel attribution.
Operations & Developers
Fast Queries & Data Accuracy
"How do we load store data fast without figures conflicting across views?"
Centralized BigQuery connection, modular components, and instant filters.
Design & Development Process
A focused 6-8 week sprint from initial audit to a working frontend application:
Data Audit & Interviews
Reviewed spreadsheets, documented conflicting formulas, and interviewed key team members.
Information Structure
Organized the system into 6 dedicated screens for sales, funnels, and inventory.
Design System & Figma
Created clean charts, retention curves, and reusable components in Figma.
Frontend Engineering
Built a fast Next.js app with instant filtering, date selectors, and responsive charts.
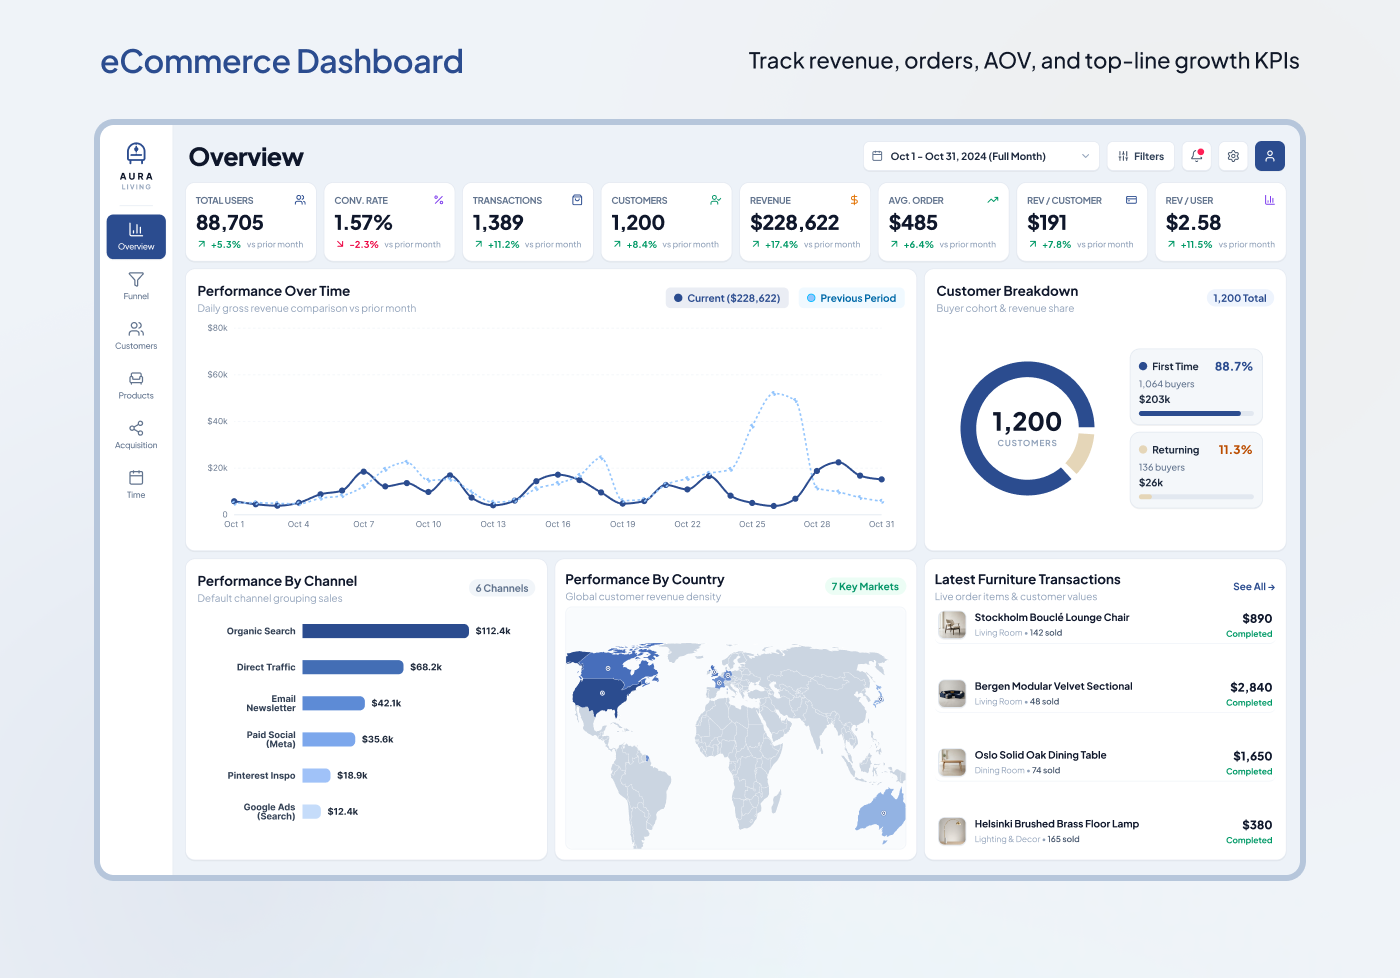
Executive Overview Dashboard
Shows core business numbers: revenue, average order value, orders, and conversion rate, with daily pacing curves.
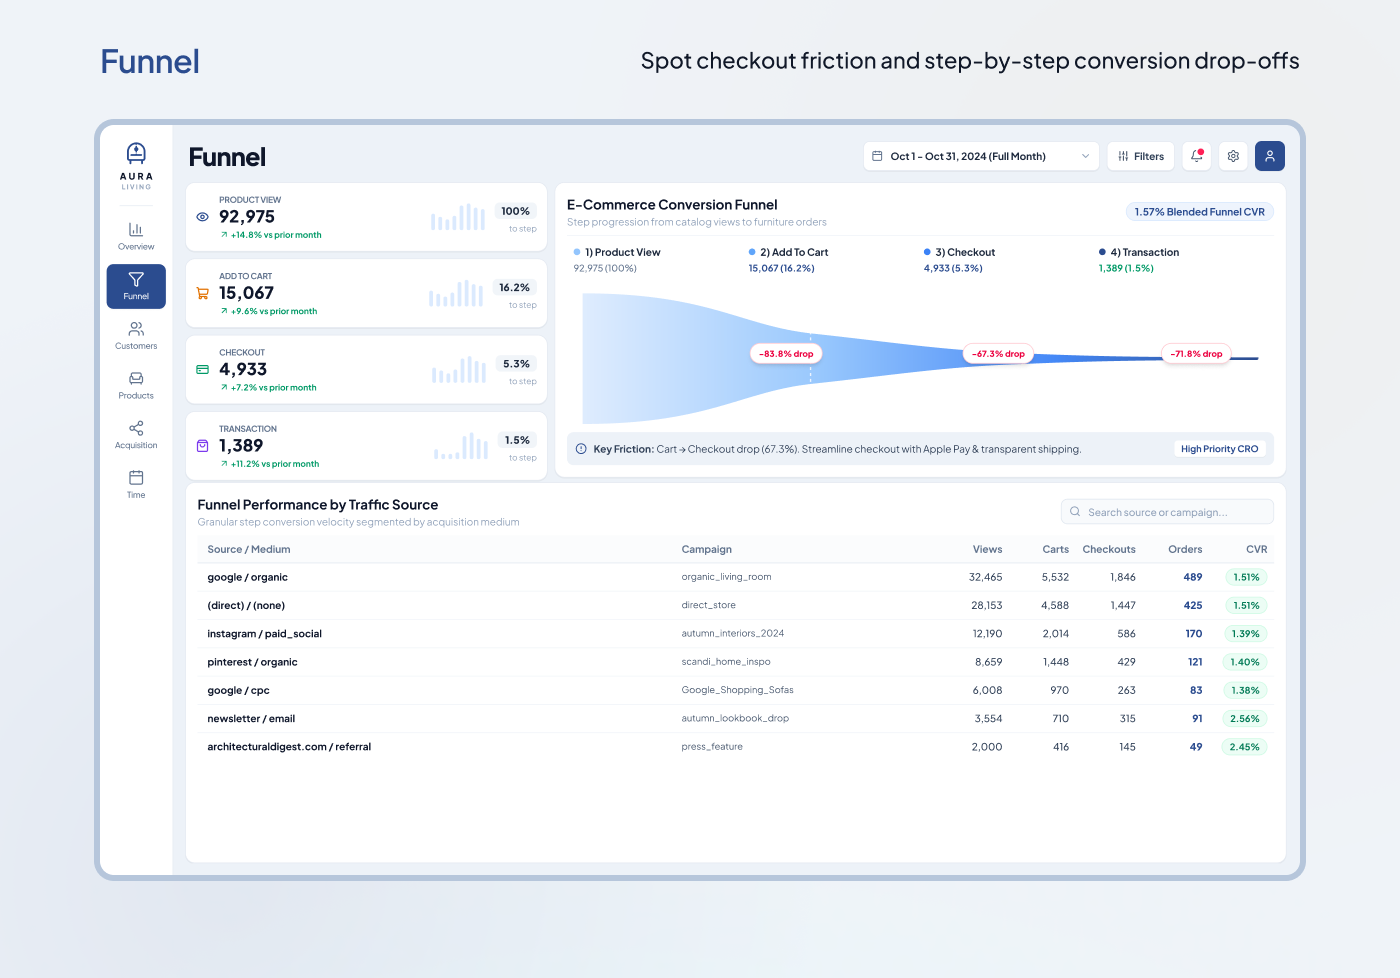
Conversion Funnel
Tracks buyer progress from product views and cart additions to completed checkouts, highlighting drop-offs.
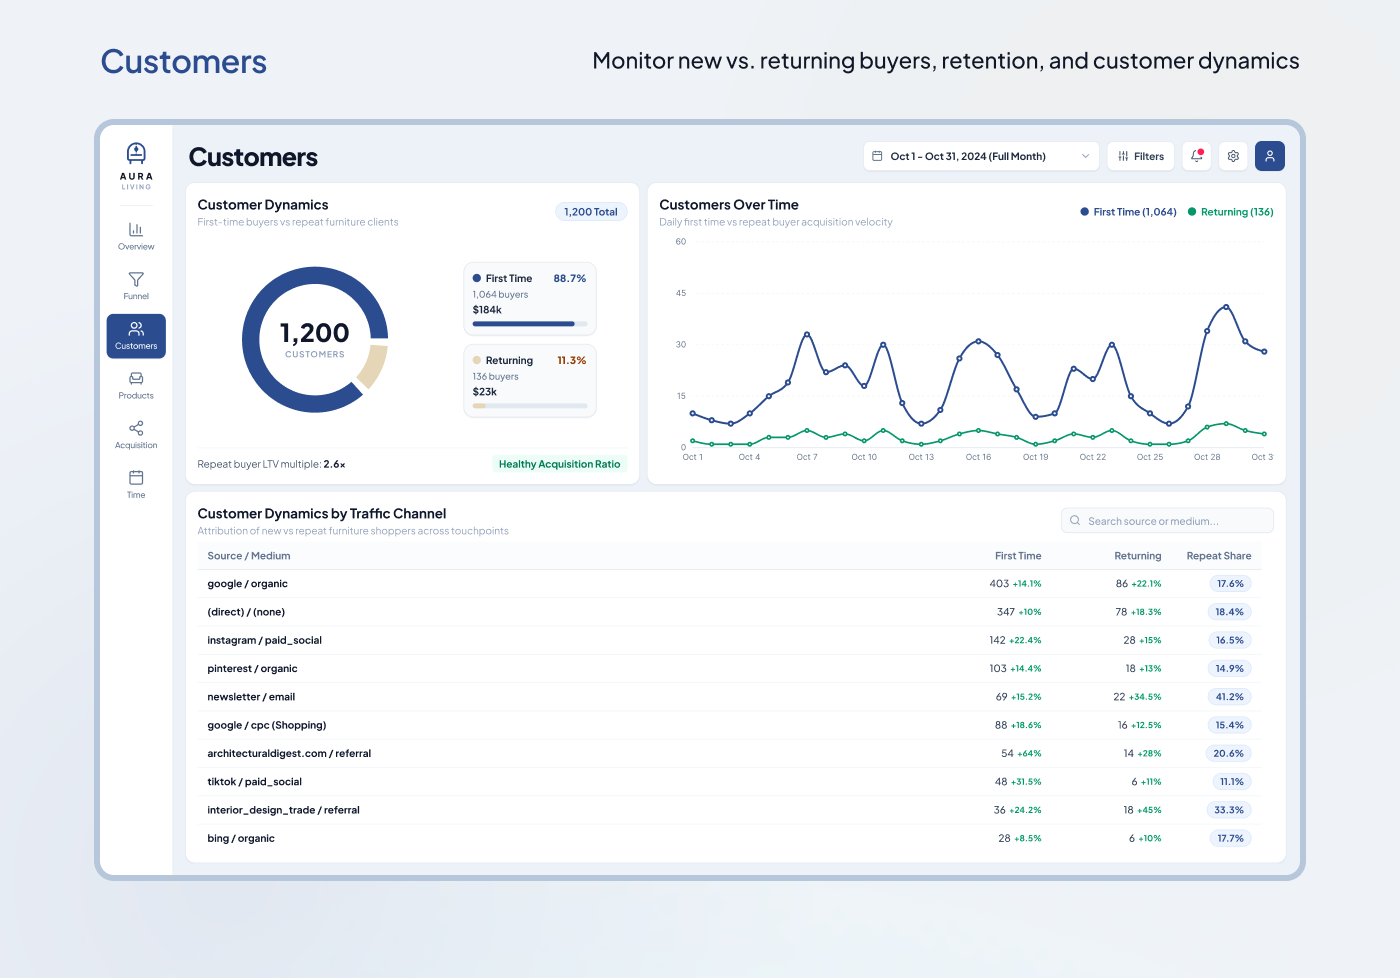
Customer Retention Matrix
Shows repeat purchase patterns across 30, 60, and 90-day intervals to track customer loyalty over time.
Key Decisions
Simple interface choices directly informed by team needs:
Top KPI Scorecard
Vital numbers were buried in raw transaction rows, slowing daily reviews.
Top cards with comparative pacing curves for instant sales visibility.
Question-Driven Charts
Generic charts hid checkout drop-offs and repeat buyer trends.
Step-down funnel bars for checkout friction and cohort tables for repeat sales.
6 Dedicated Screens
Cramming sales, ad channels, and stock onto one screen caused clutter.
Clean, dedicated screens organized under simple sidebar navigation.
Reusable Code Components
Static mockups broke when product names or date ranges changed.
Modular React components built to handle real dynamic data safely.
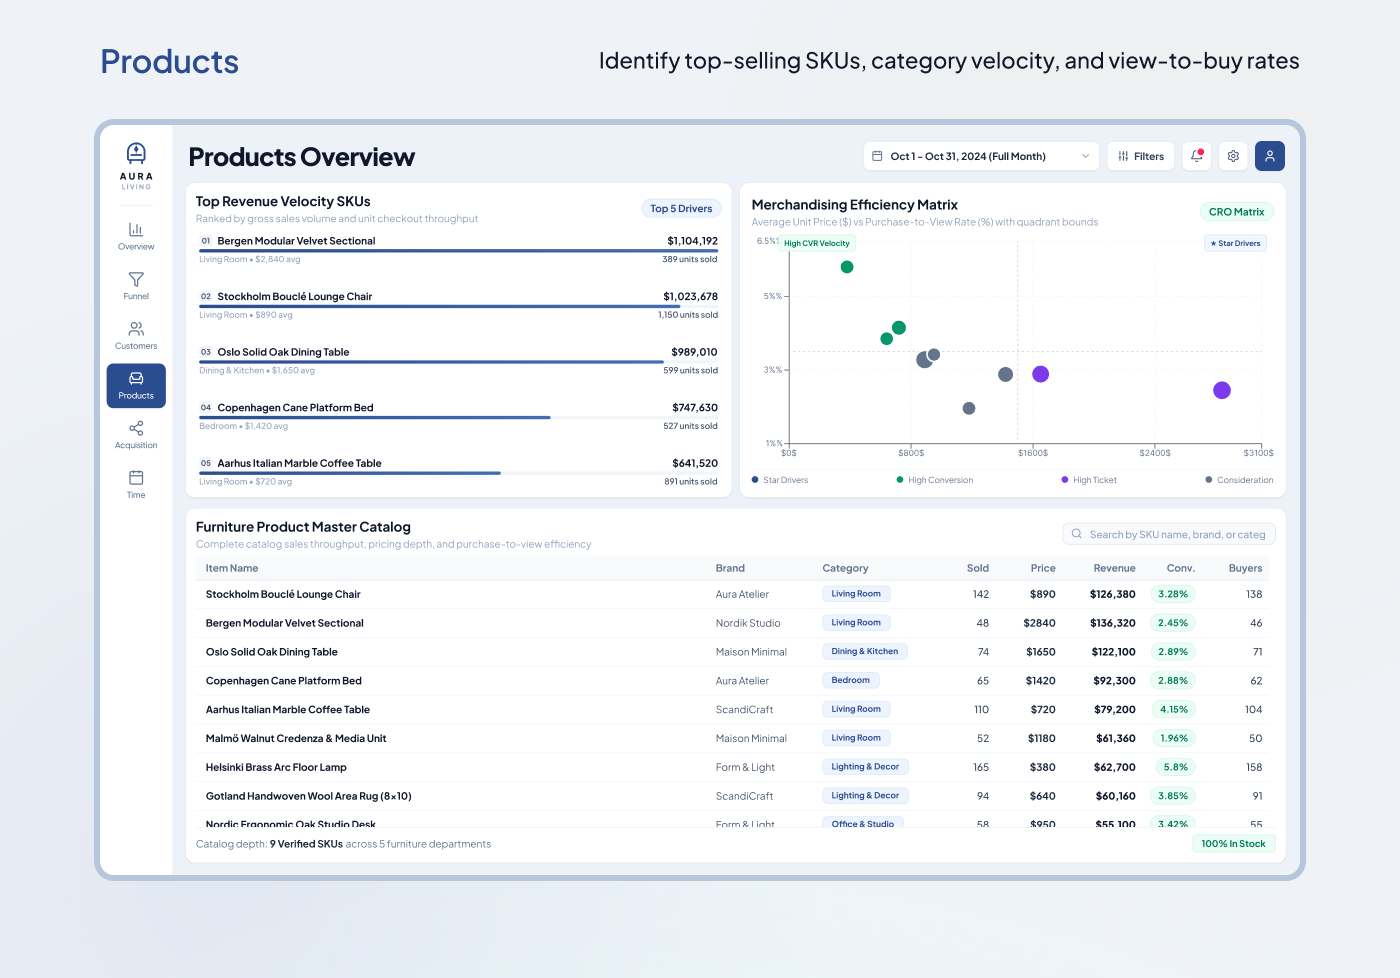
Product Catalog & Unit Economics
Tracks product margins, return rates, inventory turnover velocity, and restock alerts across the catalog.
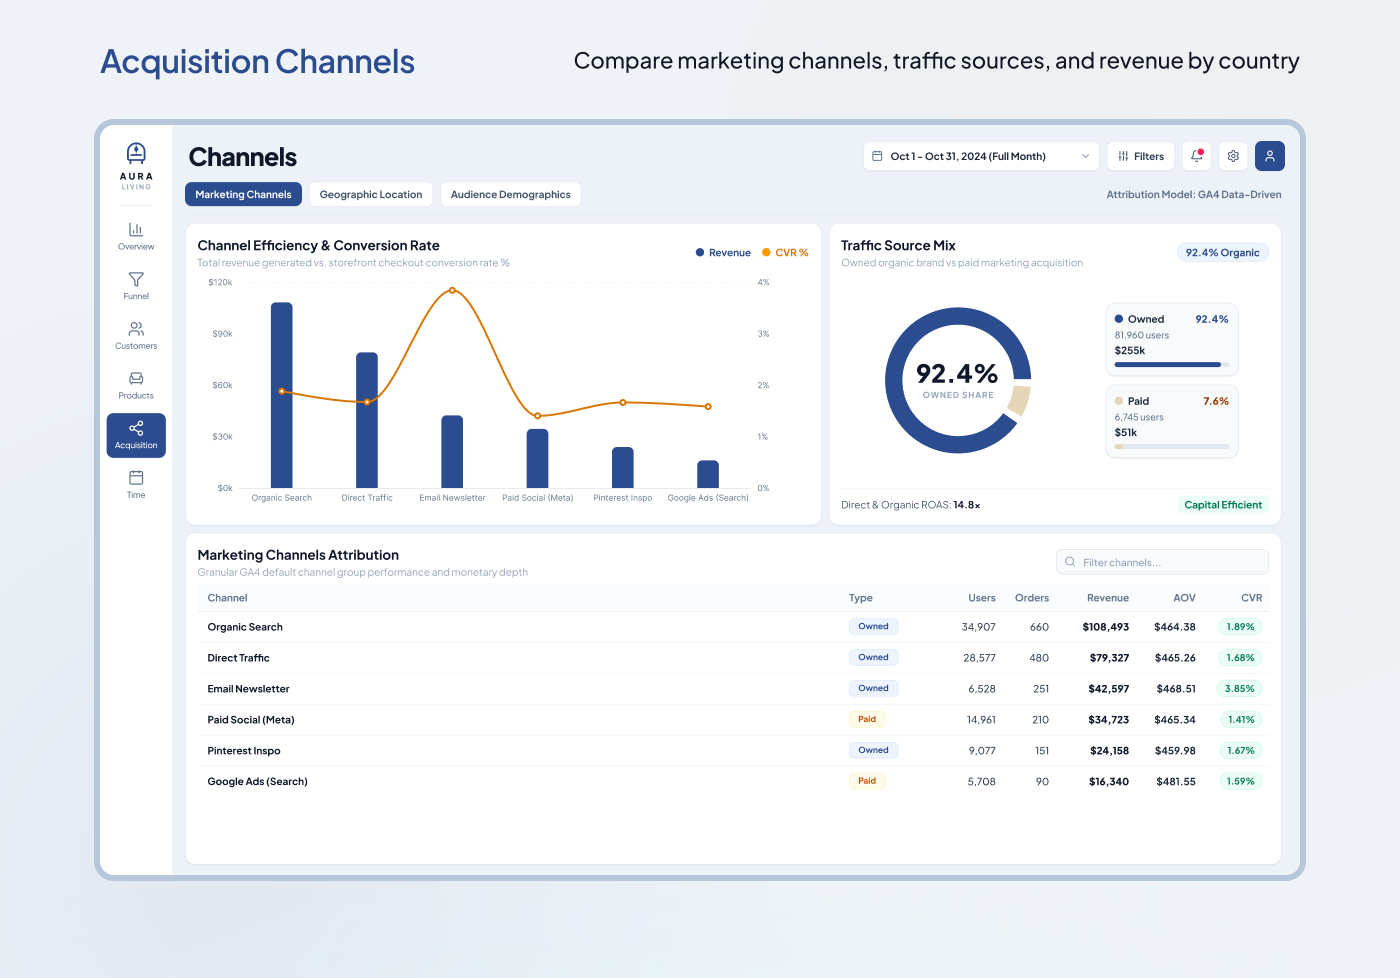
Marketing Channel Attribution
Compares sales across marketing channels and direct traffic to see where ad spend works best.
Tech Stack
A clean, modern setup built for fast loading and responsive filtering:
Raw Store Data
Orders, inventory, and ad tracking logs.
Google BigQuery
Clean storage and structured KPI tables.
Server Handlers
Fast endpoints running simple queries.
Next.js Frontend
Reusable React components with date filters.
Results & Impact
The new system gave the team clear daily numbers they could trust:
Design System & Tokens
Built a simple Figma token library and reusable React components for future updates.
Automated Data Pipeline
Connected store sales and ad channels into BigQuery, removing manual spreadsheet work.
Single Source of Truth
Aligned sales and revenue definitions across leadership and marketing teams.
Faster Daily Decisions
Gave the team instant visibility into product margins, buyer drop-offs, and hourly trends.
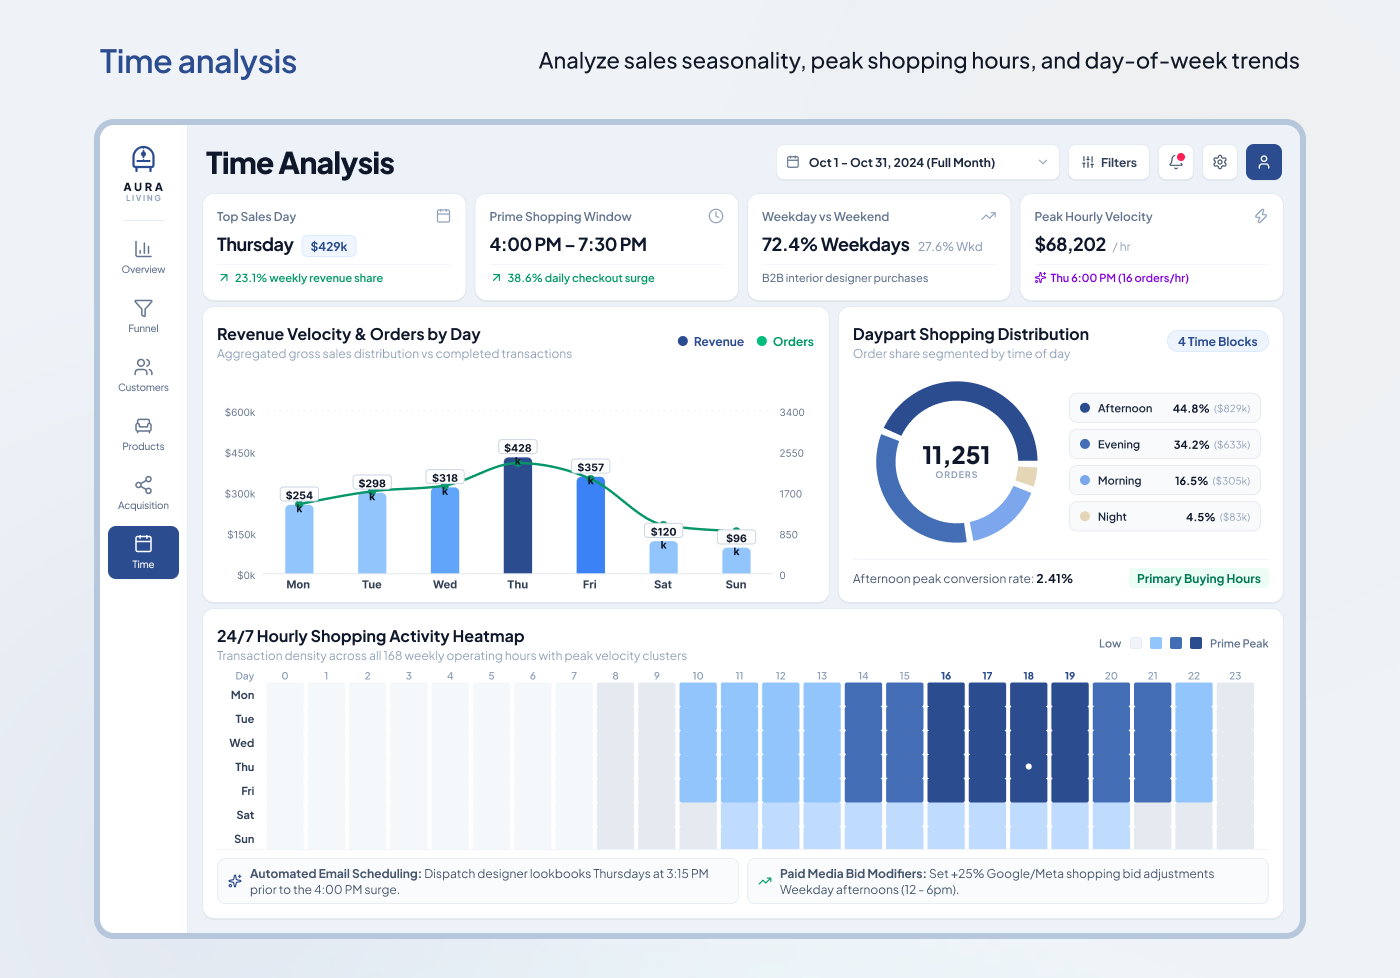
Sales by Hour & Day
Shows order speed and visitor traffic by hour and day to find peak shopping windows.
Ongoing Maintenance & Usability
After delivering the dashboard, work shifted to fixing bugs, improving usability, adding new metrics, and adjusting existing calculations.
Planning Additional Data Sources
Planning the integration of additional store and marketing data sources to expand reporting coverage across the platform.
Gallery
All operational dashboard views developed for the platform. Click any view to inspect full size: