Dashboards & Data Viz
Data Visualization & High-Impact Financial Information Design
End-to-end UX and information design for quantitative dashboards across digital banking, crypto asset management, commercial real estate, and enterprise software platforms.
Crypto Portfolio & Reinvestment
Main investor console providing instant visibility into total digital asset holdings, daily returns, and one-click compounding:
Consolidated Portfolio Totals
Large, high-contrast figures display total account valuation, active locked deposits, and 24-hour profit at the very top.
Direct Reinvestment Action
A dedicated reinvestment control allows users to compound daily staking interest into active deposit plans without leaving the view.
Recent Transaction Feed
Real-time activity log detailing deposits, payouts, and withdrawals with clear color-coded status badges.
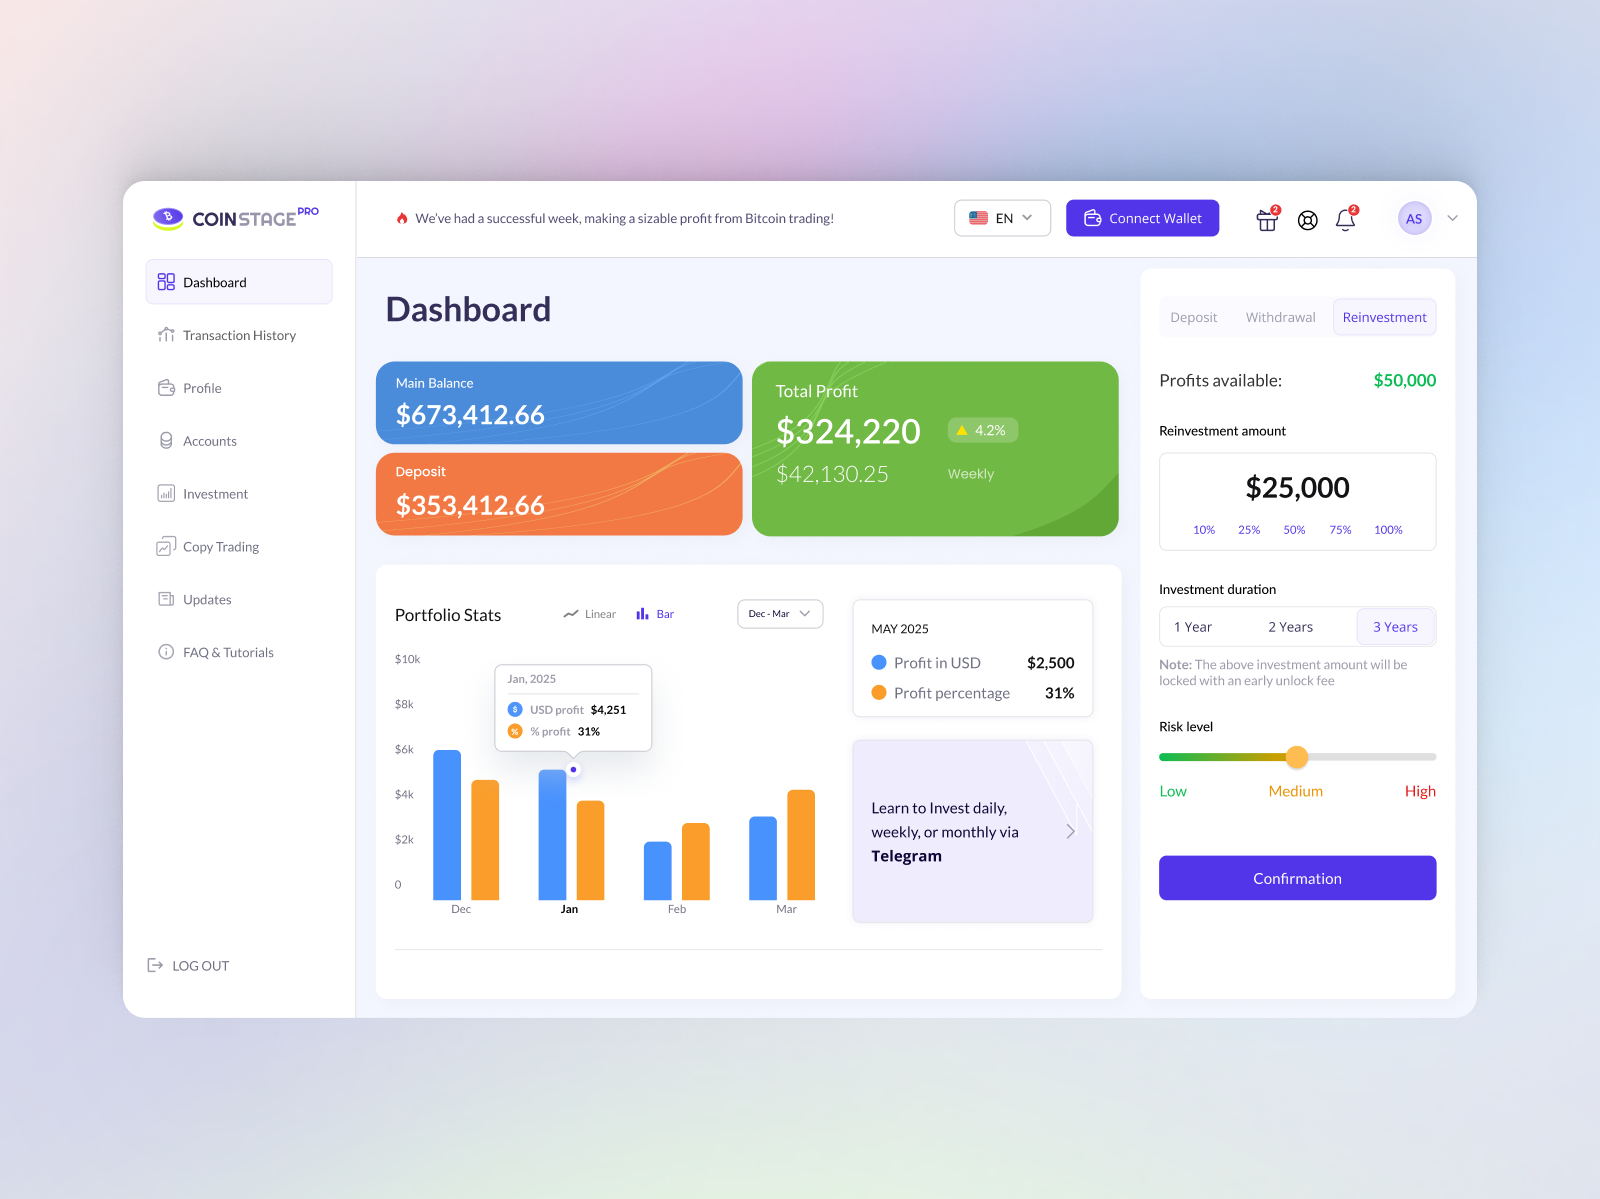
Crypto Portfolio & Reinvestment
Main portfolio overview showing total balance, active plans, and daily compounding returns.
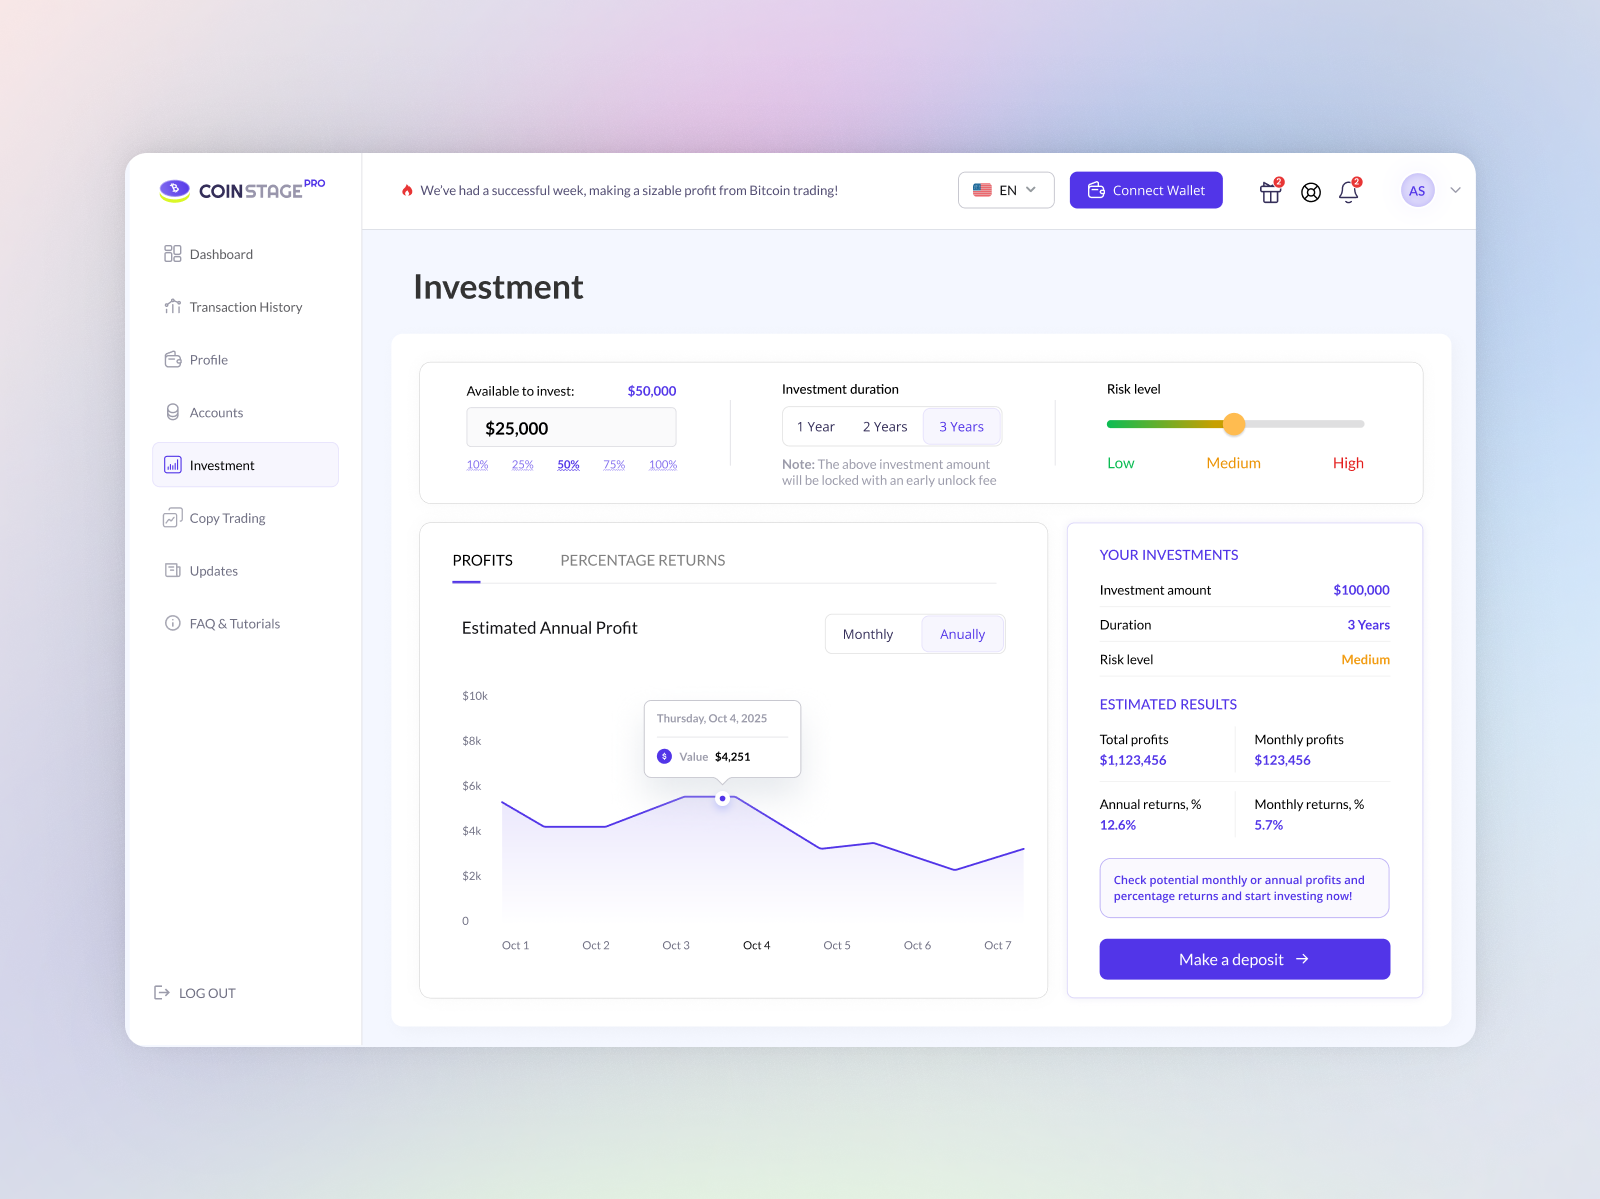
Investment Plans & Calculator
Interactive calculator letting users test deposit amounts and compare annual return tiers.
Investment Plans & Return Calculator
Interactive plan comparison allowing investors to model deposit amounts, evaluate lock-up periods, and forecast yields before committing funds:
Tiered Plan Cards
Side-by-side plan tiers showing daily yield rates, duration limits, and minimum capital requirements clearly.
Interactive Earnings Slider
Users adjust deposit capital with a real-time slider to immediately see projected daily, monthly, and annual returns.
Lock Term & Exit Terms
Prominent badges display capital lock durations, early withdrawal rules, and principal refund terms upfront.
Retail Banking & Expense Tracking
Personal banking dashboard focused on daily spending habits, virtual card security, and upcoming recurring bills:
Income vs Spending Waves
A clean visual area chart tracks monthly income against expenses, helping users spot budget surpluses or deficits instantly.
Virtual Card Controls
Interactive card carousel with one-tap limit adjustment, card freezing, and secure credential viewing.
Scheduled Obligations Feed
Upcoming calendar feed reminding users of approaching utility bills, subscription renewals, and loan payments.
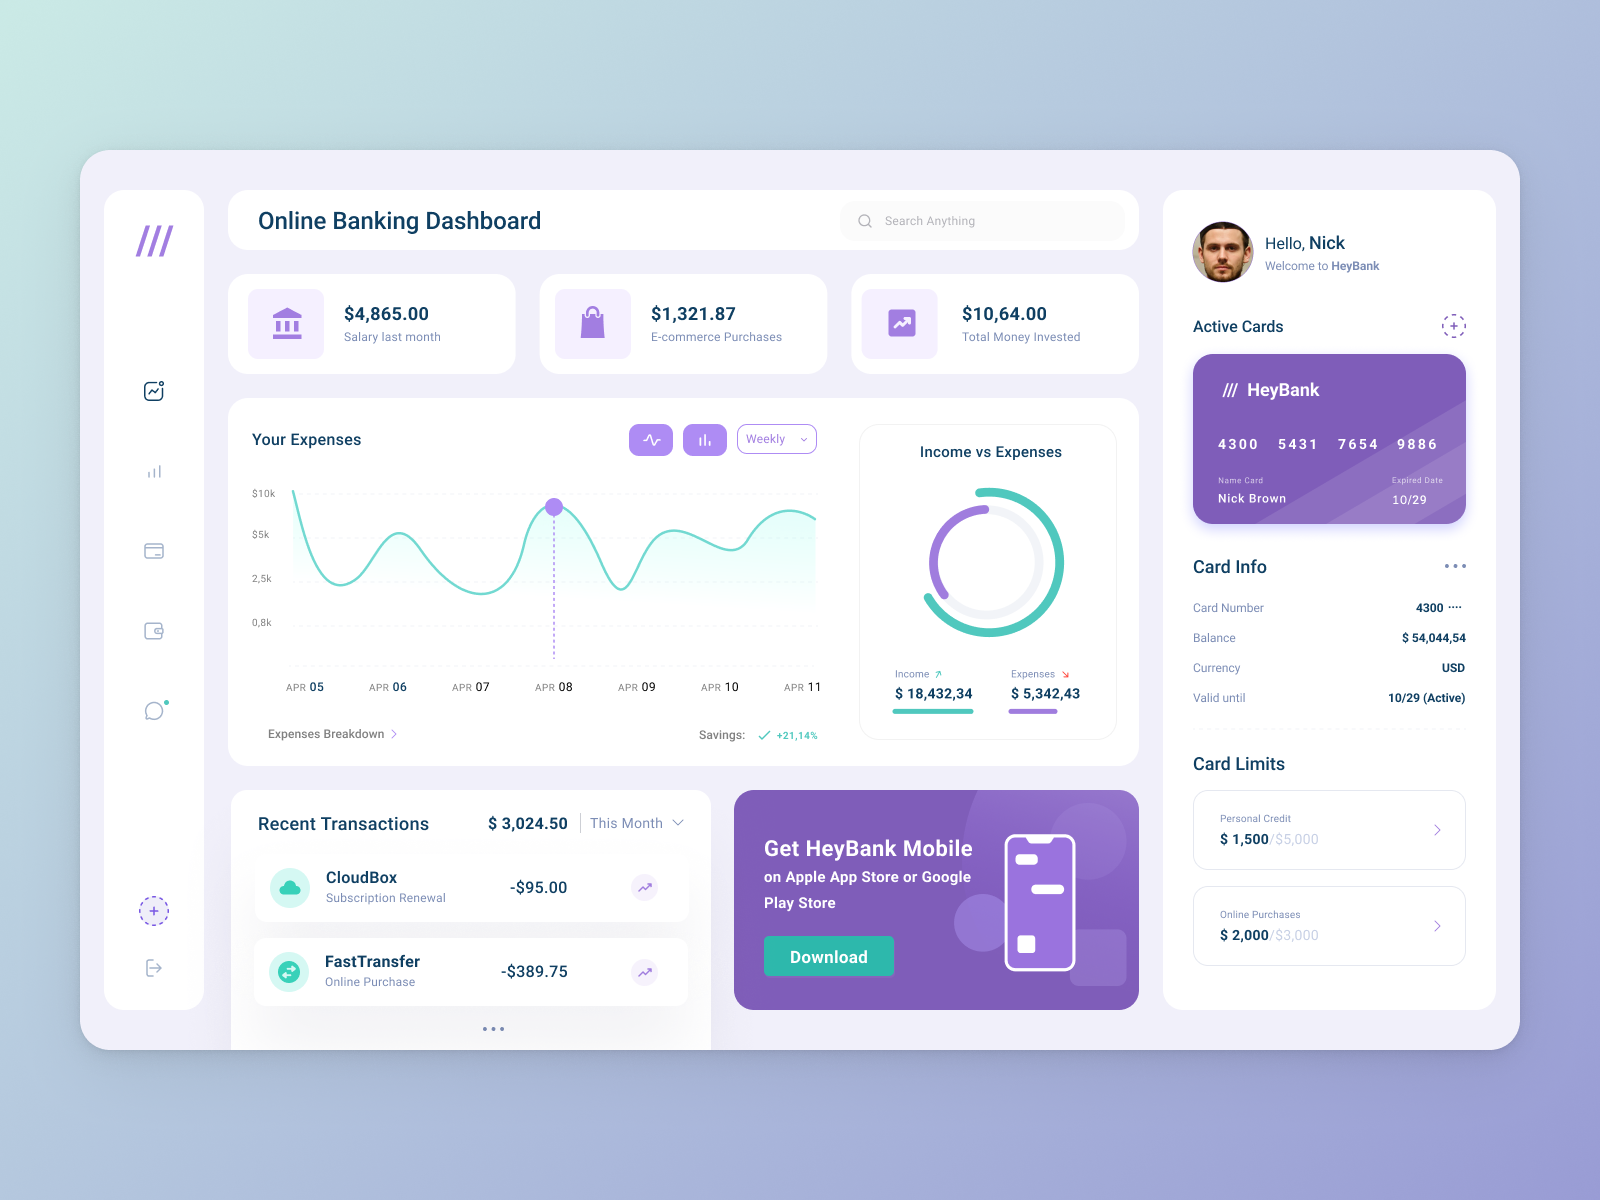
Retail Banking & Expense Tracking
Daily financial overview with spending wave charts and card management controls.
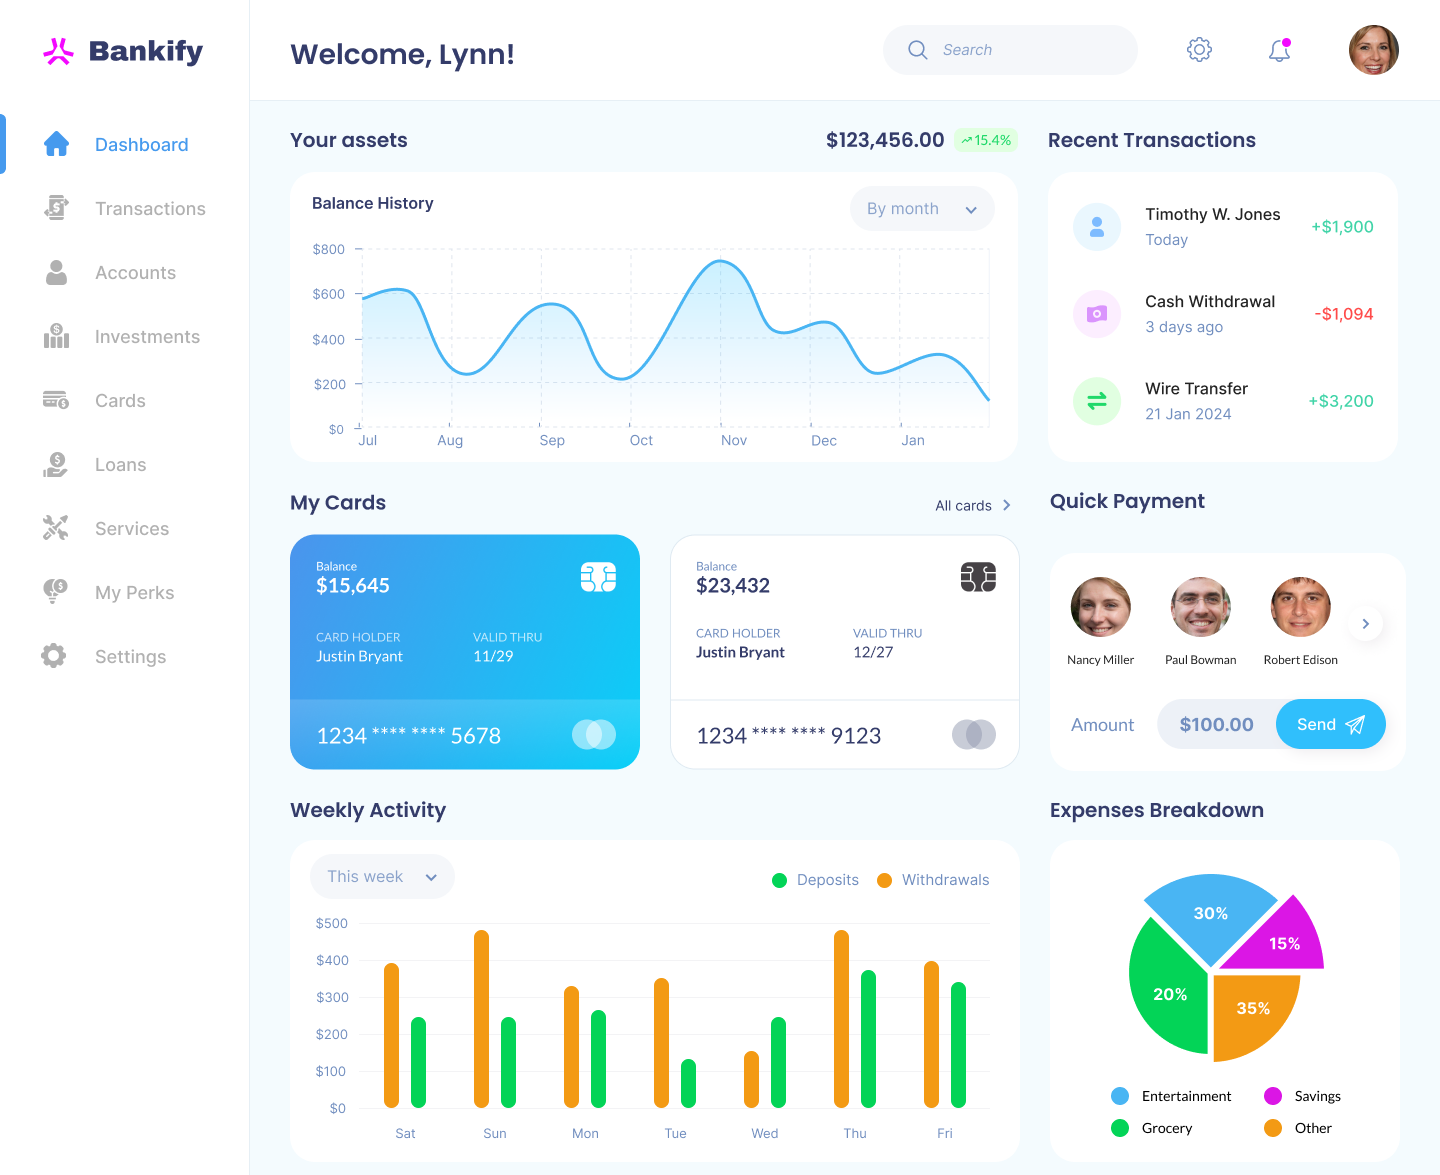
Business Cash Flow & Accounts
Monthly revenue and expense breakdowns with multi-account wallet cards.
Business Cash Flow & Accounts
Commercial banking platform helping small businesses and freelancers monitor revenue, track expenses, and move capital across multi-currency accounts:
Monthly Cash Flow Breakdown
Dual-color bar chart comparing incoming client payments directly against operational expenses for quick solvency checks.
Multi-Account Wallet Cards
Quick-switch interface for corporate debit and credit accounts, showing available credit lines and billing cycle dates.
Fast Transfer Rails
One-tap shortcuts to send money to frequent contractors, convert currencies, and download official payment receipts.
Multi-Chain Crypto Treasury
Dark-mode portfolio console engineered for active Web3 traders to monitor multi-chain balances with zero visual distraction:
Low-Strain Dark Theme
Deep neutral palette designed specifically for night trading, keeping numbers readable and reducing optical fatigue.
Cross-Chain Asset Aggregation
Unifies balances across Ethereum, Avalanche, and Arbitrum in a single clean table with live price conversions.
Inline Wrap & Bridge Rails
Action buttons built directly into asset rows let traders wrap tokens and trigger cross-chain bridges in seconds.
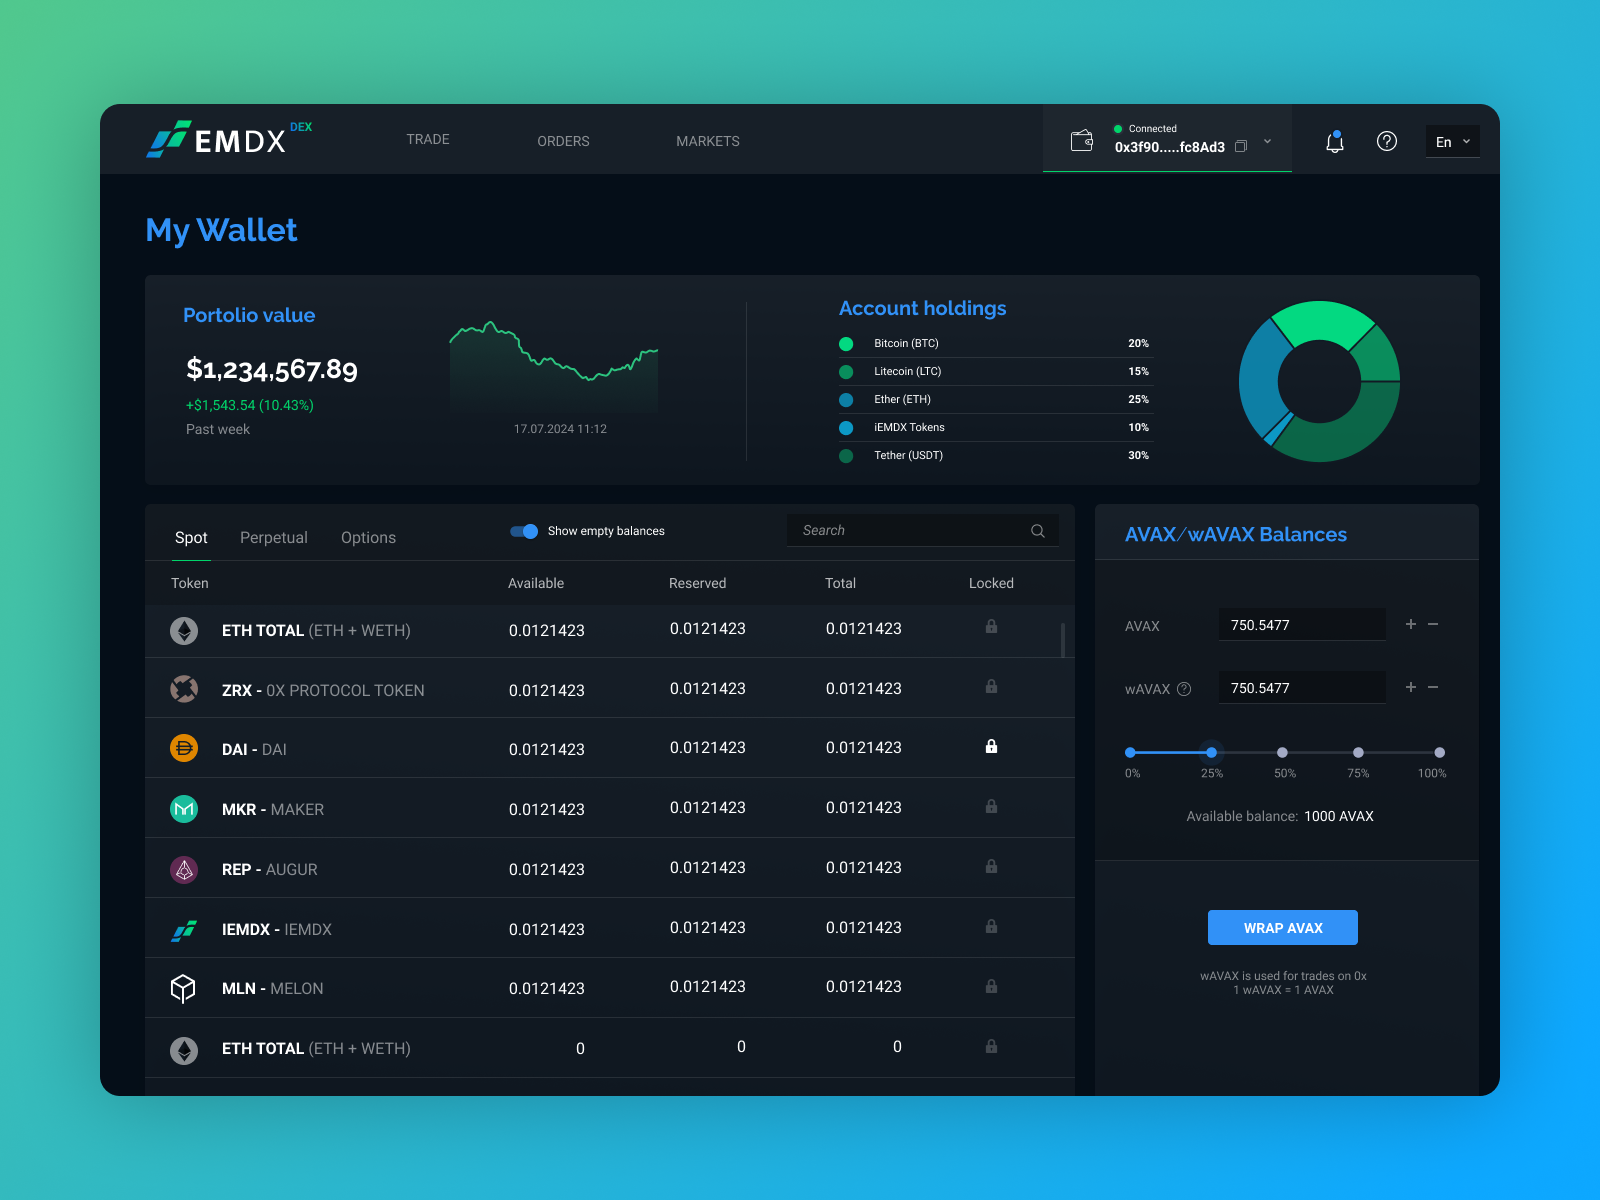
Multi-Chain Crypto Treasury
Dark-mode trader wallet consolidating assets across multiple blockchains.
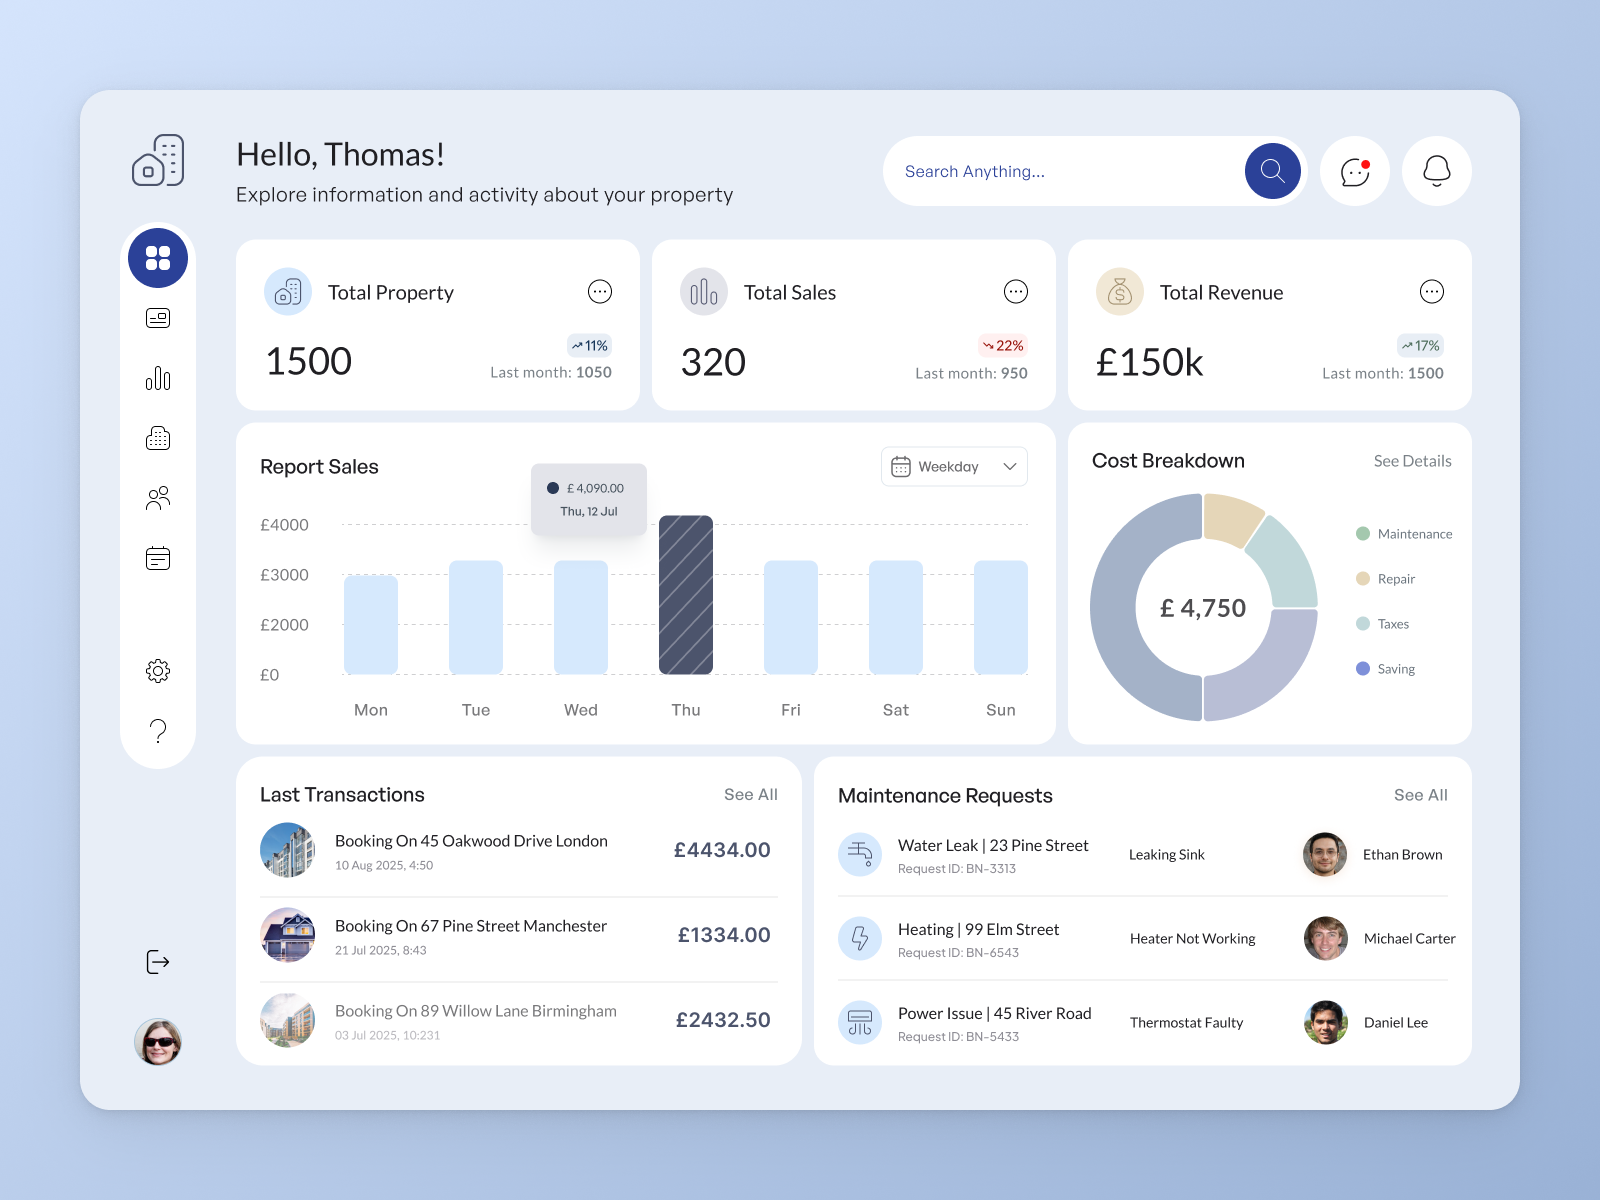
Commercial Real Estate & Rentals
Operational dashboard tracking leased units, rent roll pacing, and repair tickets.
Commercial Real Estate & Rentals
Operational dashboard for property managers and real estate teams to track tenant occupancy, rent roll collections, and repair tickets:
Occupancy & Rent Roll Health
Summary cards display total leased units, vacancy percentages, and collected monthly rent against targets.
Priority Maintenance Queue
Color-coded ticket feed organizing urgent repairs, plumbing issues, and routine building inspections.
Revenue vs Target Pacing
Tracking curves showing monthly rental cash collections compared to quarterly budget targets.
Sales Pipeline & Team Performance
Enterprise CRM console helping sales leadership track deal velocity, forecast quarterly revenue, and evaluate individual rep performance:
Visual Funnel Conversion
Multi-stage pipeline tracking leads through discovery, product demo, proposal review, and final agreement signing.
Sales Leaderboard & Quotas
Ranks team members by closed revenue, win percentage, and average deal cycle length.
Live Activity Stream
Chronological feed logging recent client calls, emailed agreements, and scheduled product demos.
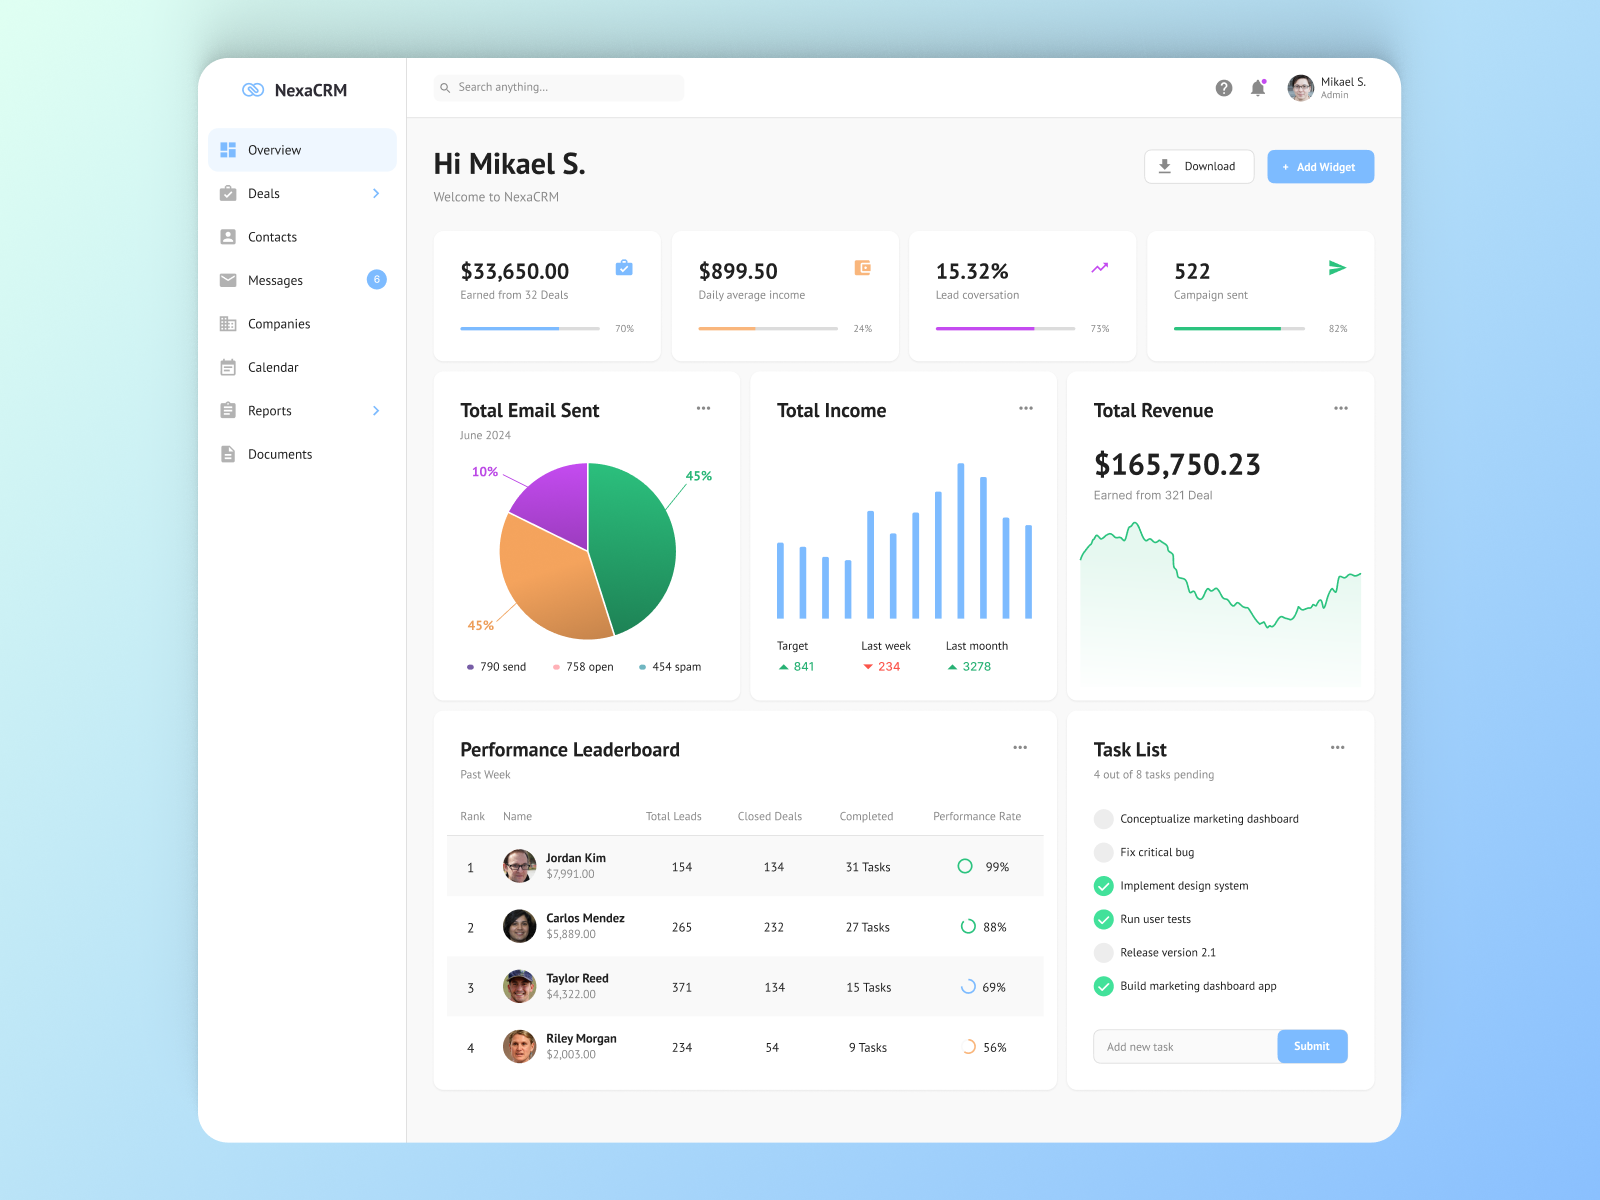
Sales Pipeline & Team Performance
Deal funnel stages, revenue forecasts, and team conversion leaderboards.
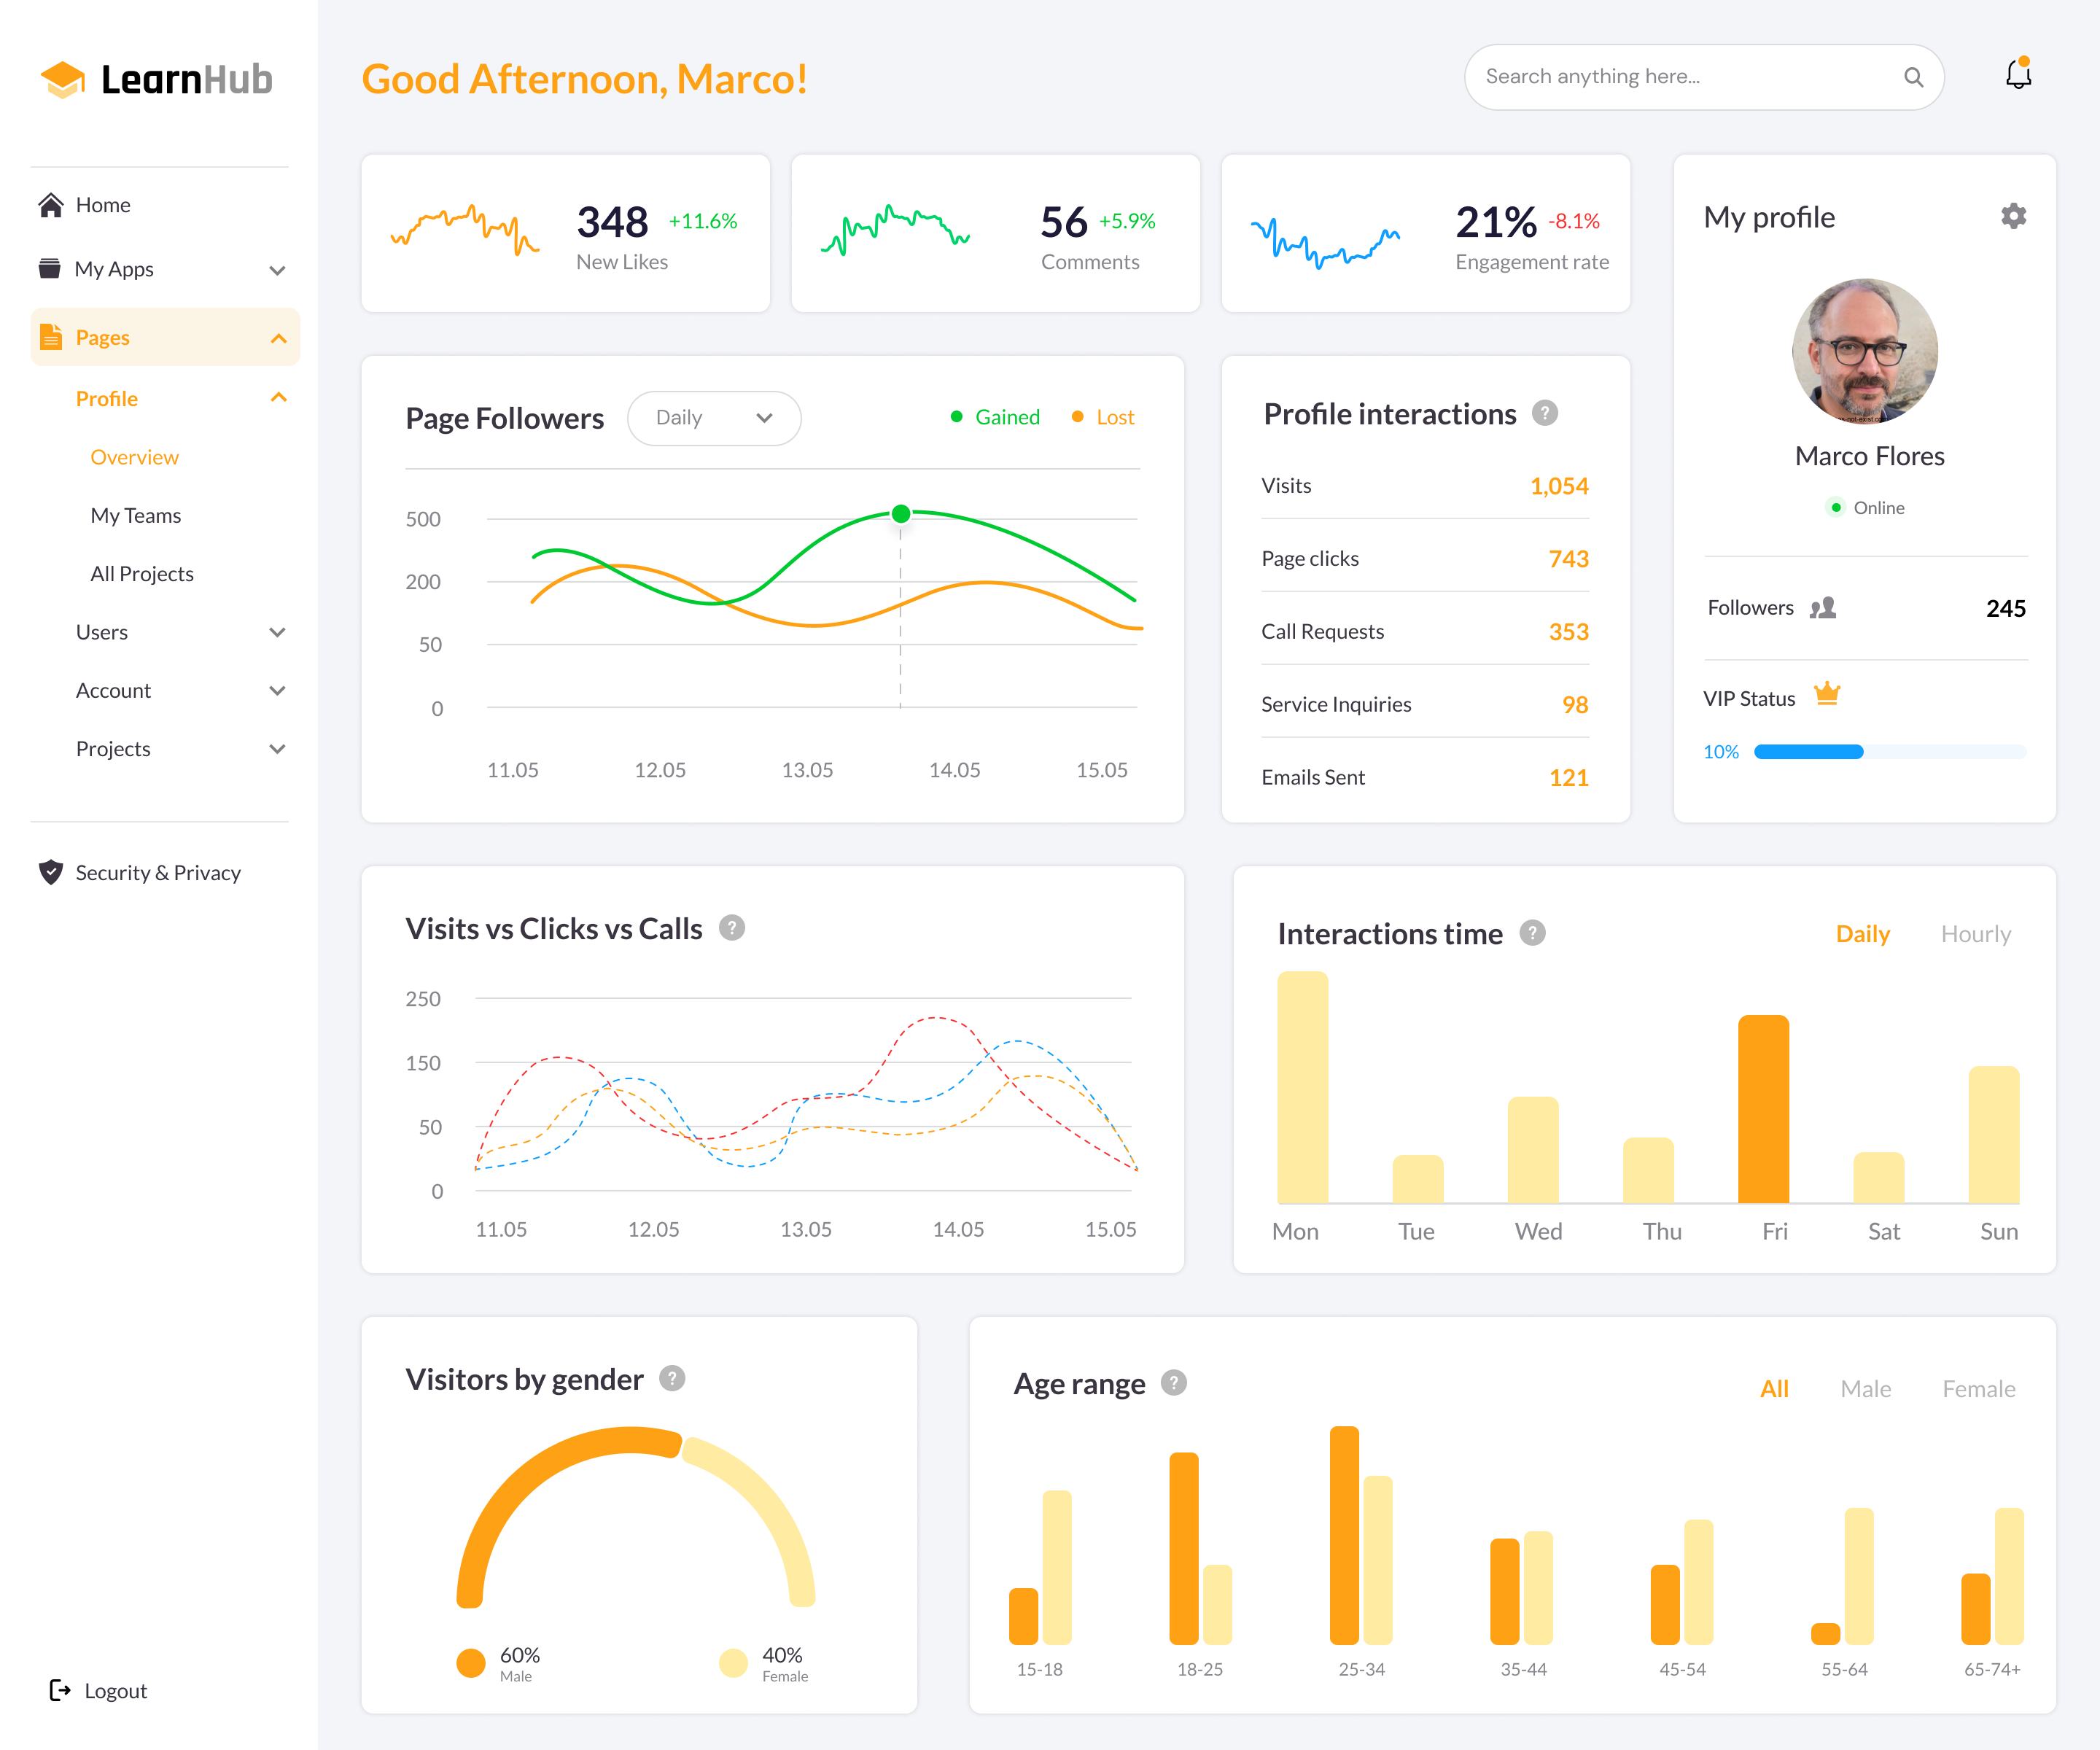
Audience Growth & Engagement
Telemetry dashboard tracking daily follower churn, engagement peaks, and demographics.
Audience Growth & Engagement
Creator and media analytics console monitoring daily follower churn, engagement momentum, and audience demographics across platforms:
Follower Growth & Churn
Dual-line chart comparing gained vs lost followers day by day to isolate high-impact publishing dates.
Hourly Engagement Peaks
Heatmap bar chart identifying the exact hours when audience members interact with posted content.
Demographic Age Distribution
Clean bar groupings displaying audience age cohorts and gender splits to inform future content planning.
Dashboard Design System
Core design rules used across all dashboard projects to ensure high readability, fast scanning, and consistent visual clarity:
Clear Color Meaning
Green indicates profit and positive growth, red signals losses or urgent alerts, and neutral grays keep standard cards calm and easy to scan.
Readable Key Metrics
Crucial numbers like total balance and monthly revenue are displayed in large, bold text with small trend tags right underneath.
Simple Chart Styles
Line charts for trends over time, bar charts for comparisons, and clean donut charts for category splits. Faint gridlines keep data front and center.
Fast Time Controls
One-click time filters (Day, Week, Month, Year) and search bars let users update the dashboard instantly without full page reloads.
Gallery
Full view of all 8 production dashboard layouts across fintech, crypto, real estate, and enterprise software: