Financial Reports & Data Viz
Executive Information Design, Quantitative Analytics & Institutional Publications
High-impact financial information design transforming dense macroeconomic datasets, on-chain analytics, and derivatives volume metrics into clean institutional research publications.
Teroxx & Enterprise Clients
Multi-Year Portfolio Collection
Lead Information & Visual Designer
Financial Report Templates & Data Viz
Bridging Sovereign Macro with Digital Liquidity
Institutional family offices, private wealth managers, and asset allocators require financial reporting that eliminates decorative noise in favor of high-density quantitative clarity. When central banks initiate rate easing cycles, allocators evaluate sovereign bond yields, currency fluctuations, and equity indices in direct comparison with digital asset liquidity.
This editorial intelligence publication for Teroxx establishes a cohesive visual language combining classical financial publishing rigor with modern data graphic precision. Traditional asset classes and digital assets are presented through standardized tabular matrices, multi-timeframe returns, and contextual macroeconomic commentary.
- Multi-asset performance matrix across digital assets, equities, yields, and FX
- 7-day, 30-day, and Year-to-Date normalized return deltas
- Central bank interest rate decisions and sovereign curve analysis

The Quantitative Legibility Challenge in Institutional Finance
Financial reports frequently fail due to excessive ornamentation, non-standardized chart scales, and fragmented typography. Institutional readers demand rigorous data density, immediate comparative legibility, and high publication standards for print and digital formats.
High Data-to-Ink Ratio
Eliminating decorative chart junk and background artifacts so every pixel conveys measurable mathematical variance and market depth.
Multi-Asset Normalization
Aligning disparate metrics such as bond basis points, equity multiples, and crypto token supplies on consistent comparative baselines.
Tabular Number Alignment
Clean proportional numbers and column decimal alignment enabling instantaneous vertical scanning across balance sheets.
Vector & Print Precision
Flawless dual-format rendering calibrated for 300 DPI high-resolution CMYK print delivery as well as crisp retina displays.
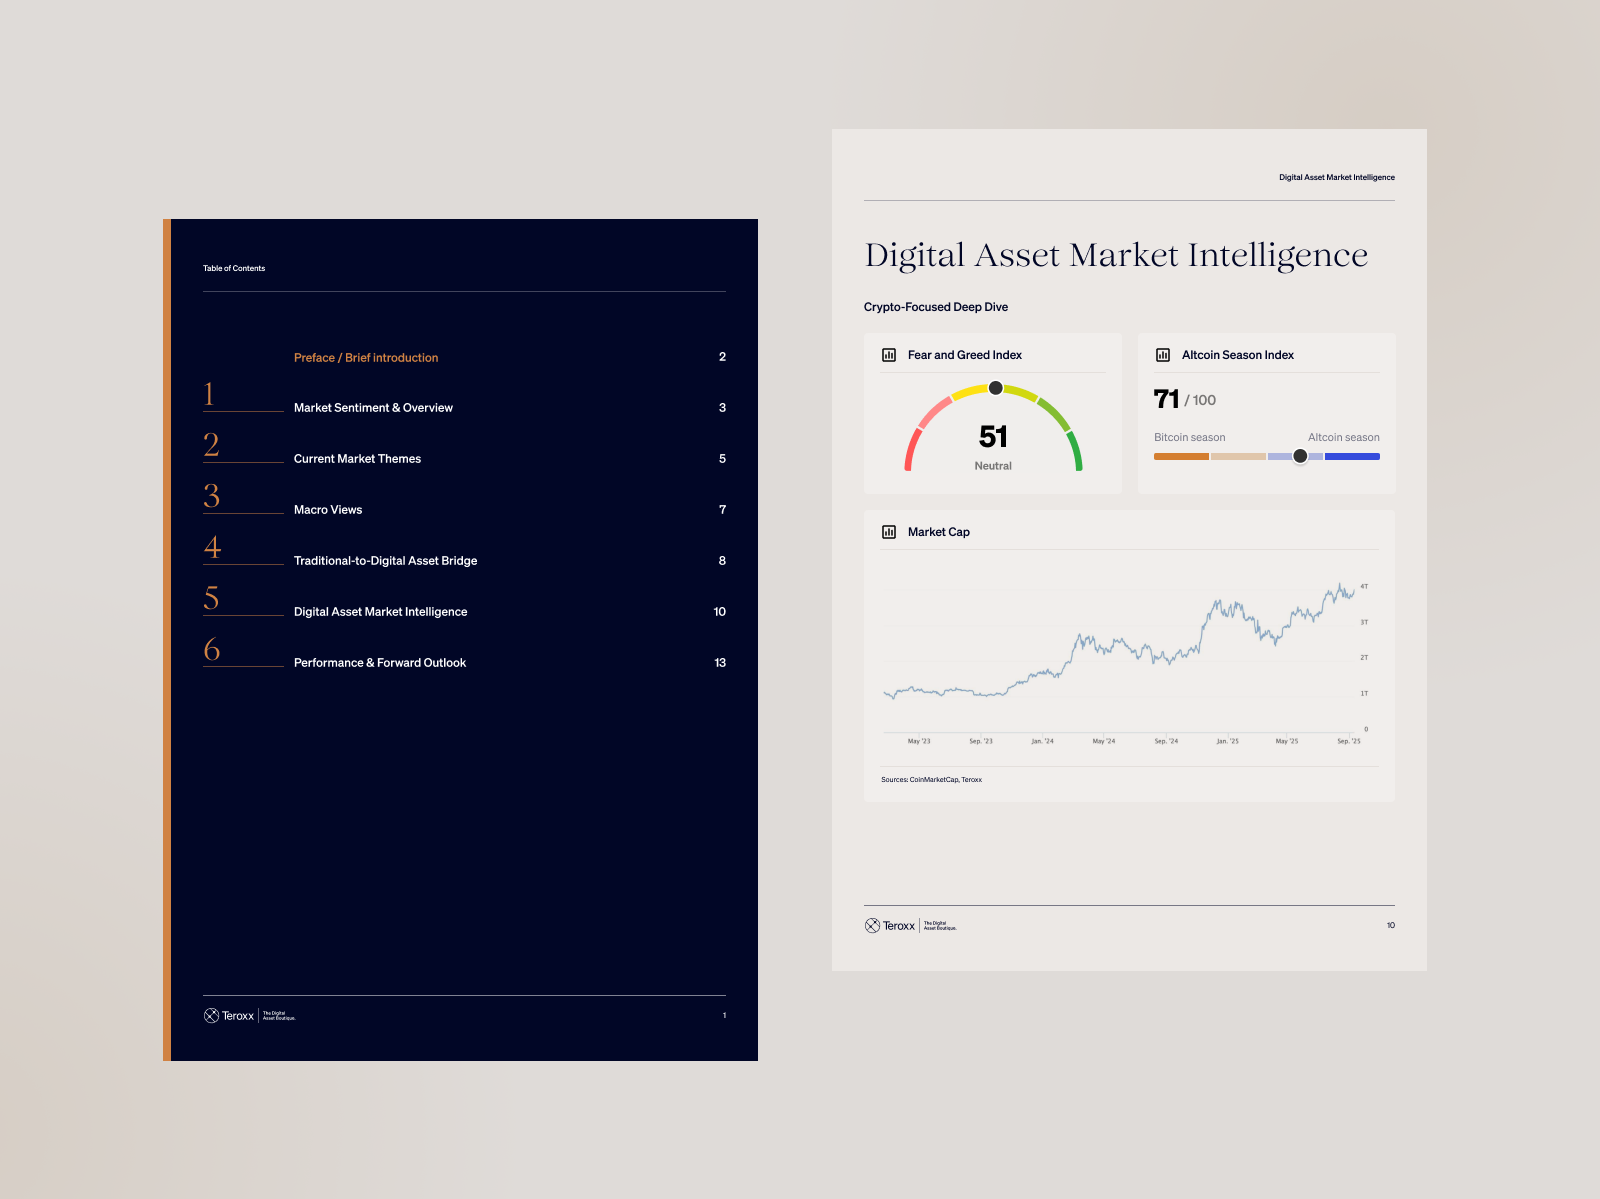
Radial Sentiment Gauges & Market Capitalization Waves
Executive readers require rapid cognitive orientation before diving into detailed sector breakdowns. The publication architecture utilizes a high-contrast radial Fear and Greed gauge paired alongside an Altcoin Season indicator bar, providing instant situational awareness of broader market risk appetite.
Directly below the sentiment meters, a continuous multi-year area chart illustrates aggregate digital asset market capitalization expanding toward the four trillion dollar milestone. Subtle vertical timestamp callouts allow portfolio managers to cross-reference inflection points against specific Federal Reserve policy milestones.
- Tri-color radial arc mapping neutral and extreme market conditions
- Continuous area fill highlighting cumulative market valuation cycles
- Monochrome table of contents establishing clear editorial sectioning
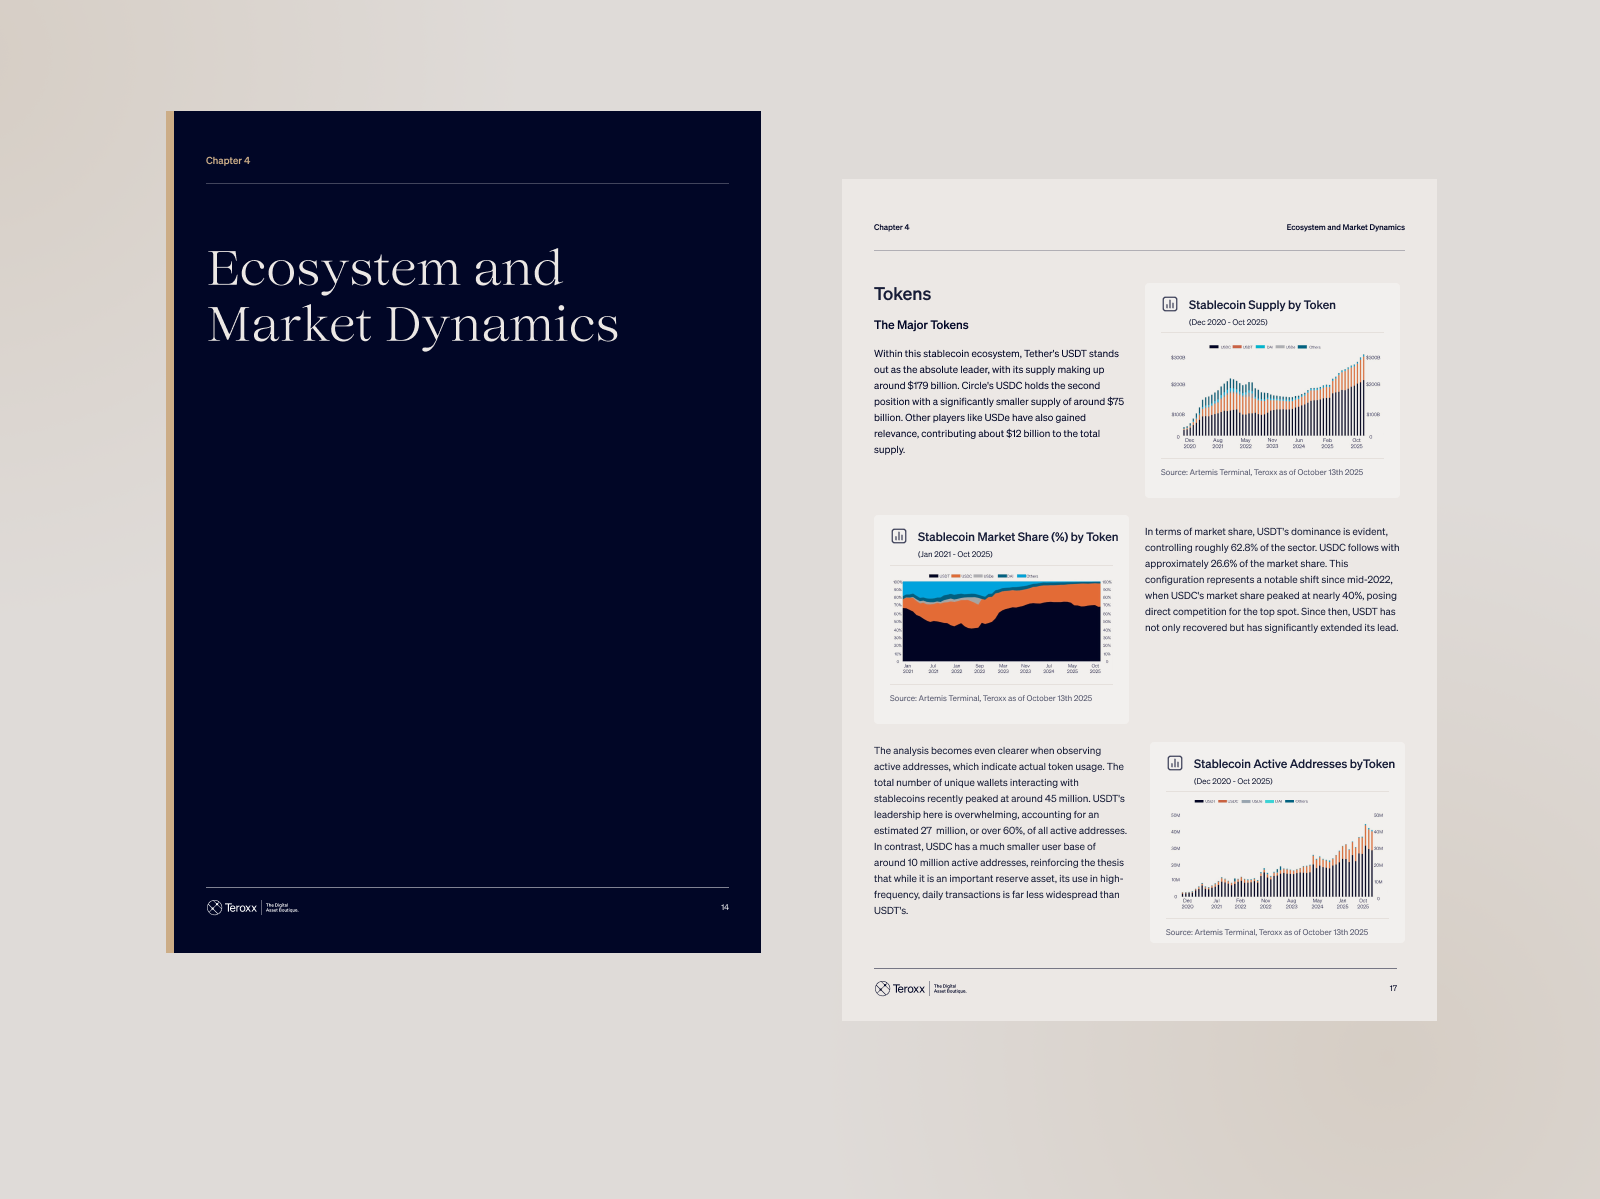

100% Stacked Area & Wallet Activity Dynamics
To capture the competitive shift between USDT, USDC, and emerging decentralized alternatives, the layout deploys a 100% stacked area chart alongside active wallet addresses. This dual visual configuration reveals both market share dominance and actual transactional velocity without confusing volume with address count.
Blockchain Settlement Share & Multi-Year Supply
Visualizing stablecoin liquidity across settlement layers requires disaggregating Ethereum Layer-1 dominance from Tron and high-speed rollup networks. The visual architecture utilizes a clean pie breakdown with direct callouts paired with chronological bar charts tracking the multi-billion dollar expansion from 2020 to 2025.
Venture Capital Flows, Layer-2 TVL & RWA Tokenization
Designed as executive research templates and institutional intelligence publications. These report frameworks focus on institutional venture deployment, geographic capital allocation, Layer-2 network adoption, and on-chain Real-World Asset (RWA) expansion.
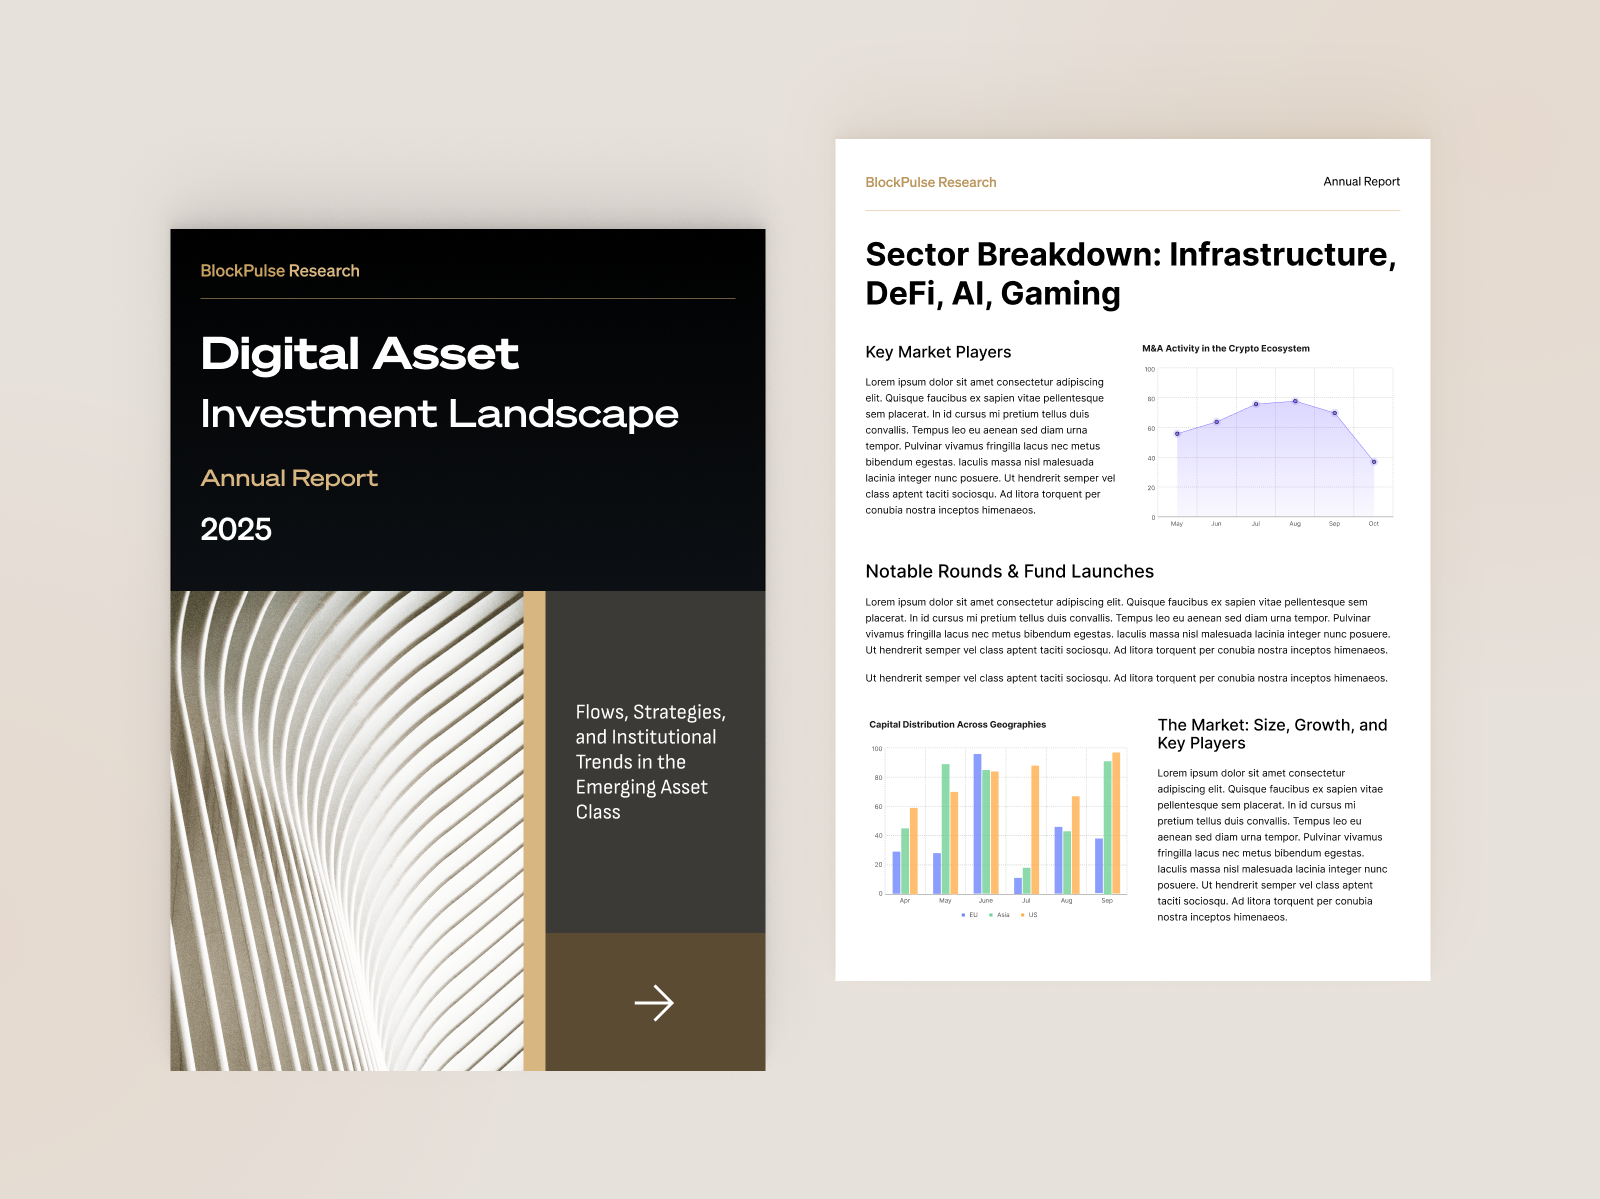
Tri-Regional Capital Allocation Comparison
Institutional fund managers tracking venture rounds need immediate regional differentiation between North American, European, and Asian investment velocity. Grouped categorical bar systems allow direct month-by-month capital flow tracking across DeFi, AI, and infrastructure verticals.
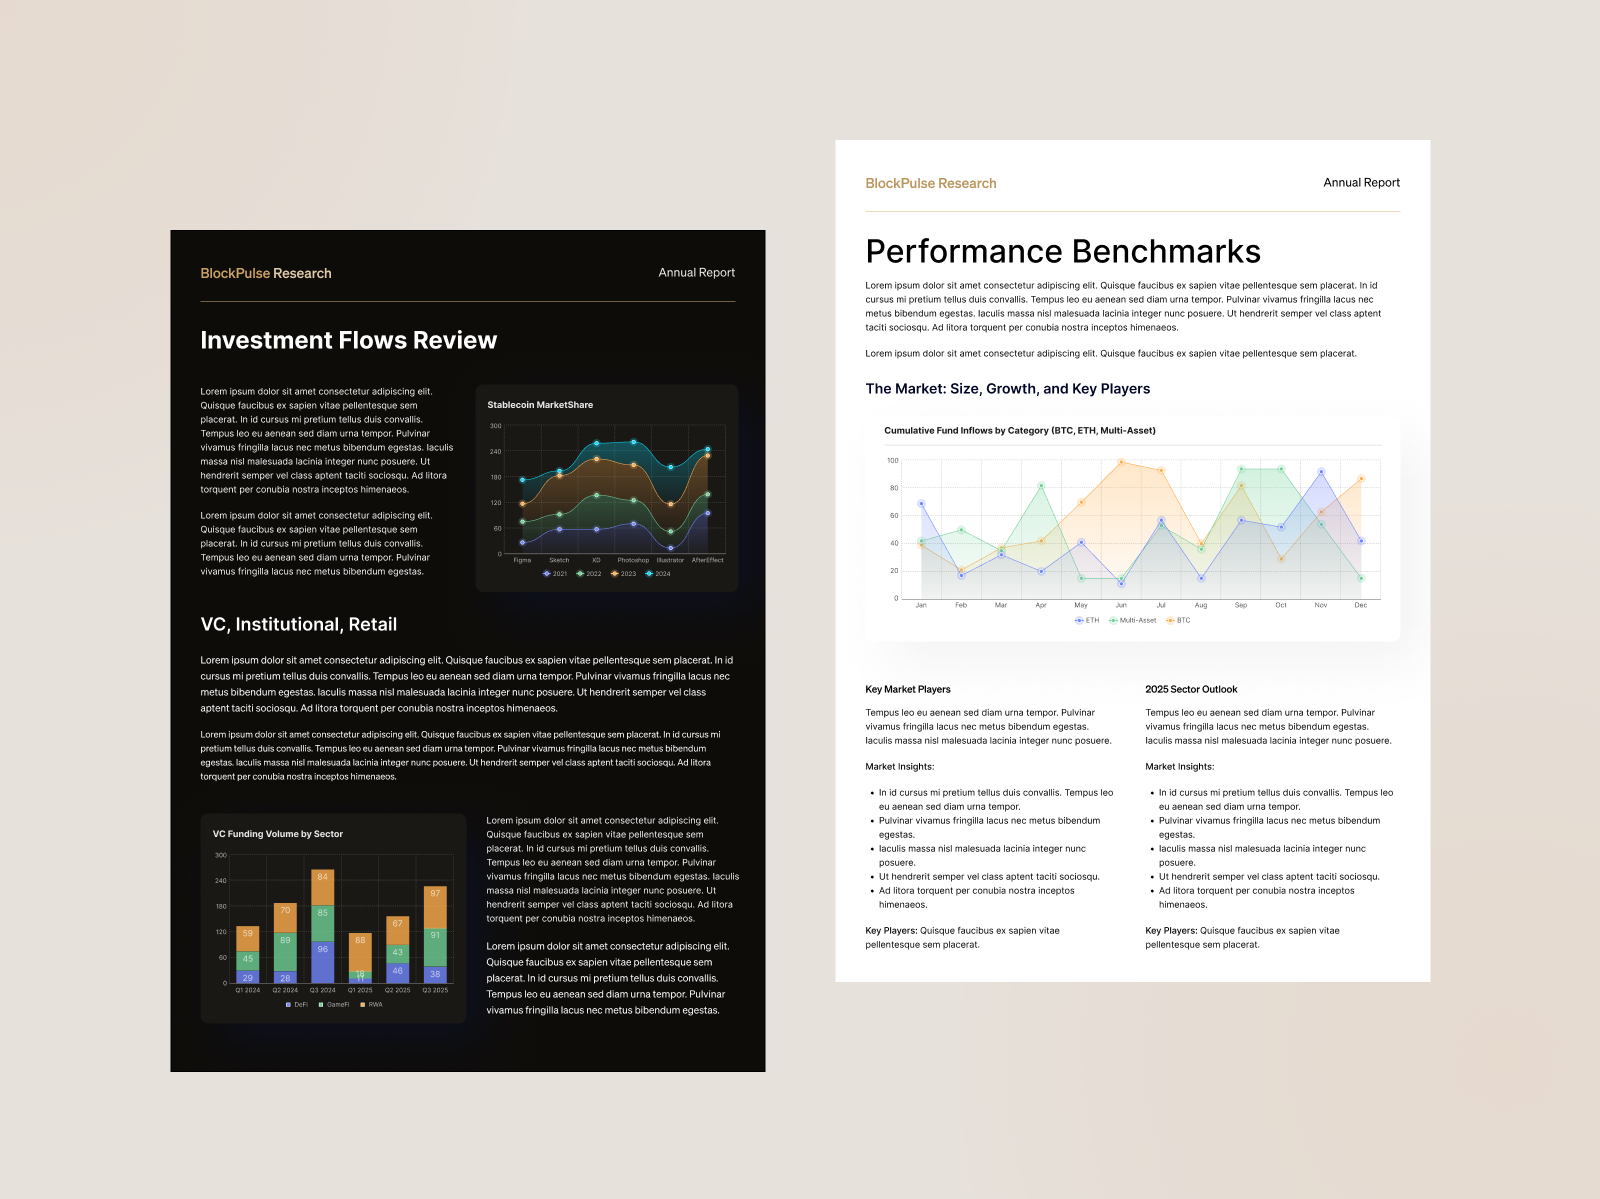
Cumulative Inflow Area Dynamics
Measuring cumulative inflows across Bitcoin, Ethereum, and diversified multi-asset crypto funds requires multi-curve filled wave geometries. The semi-transparent layers highlight periods of rotational capital switching between pure Bitcoin reserves and alternative ecosystem funds.


Radial Polar Area Distribution for RWAs
Conventional pie charts fail when one category represents over 50% while multiple emerging chains hold 2% to 5% shares. The polar area architecture varies both segment radius and angle, enabling institutional readers to resolve nuanced differences across Linea, Base, Arbitrum, and Ethereum on-chain tokenized assets.
Token Unlock Pressure vs Secondary Price Impact
To evaluate secondary market vulnerability, the publication combines scheduled token emission tranches as quarterly column histograms directly beneath a spline curve of historical market impact. Allocators can anticipate sell-side liquidity overhang prior to major cliff unlock dates.
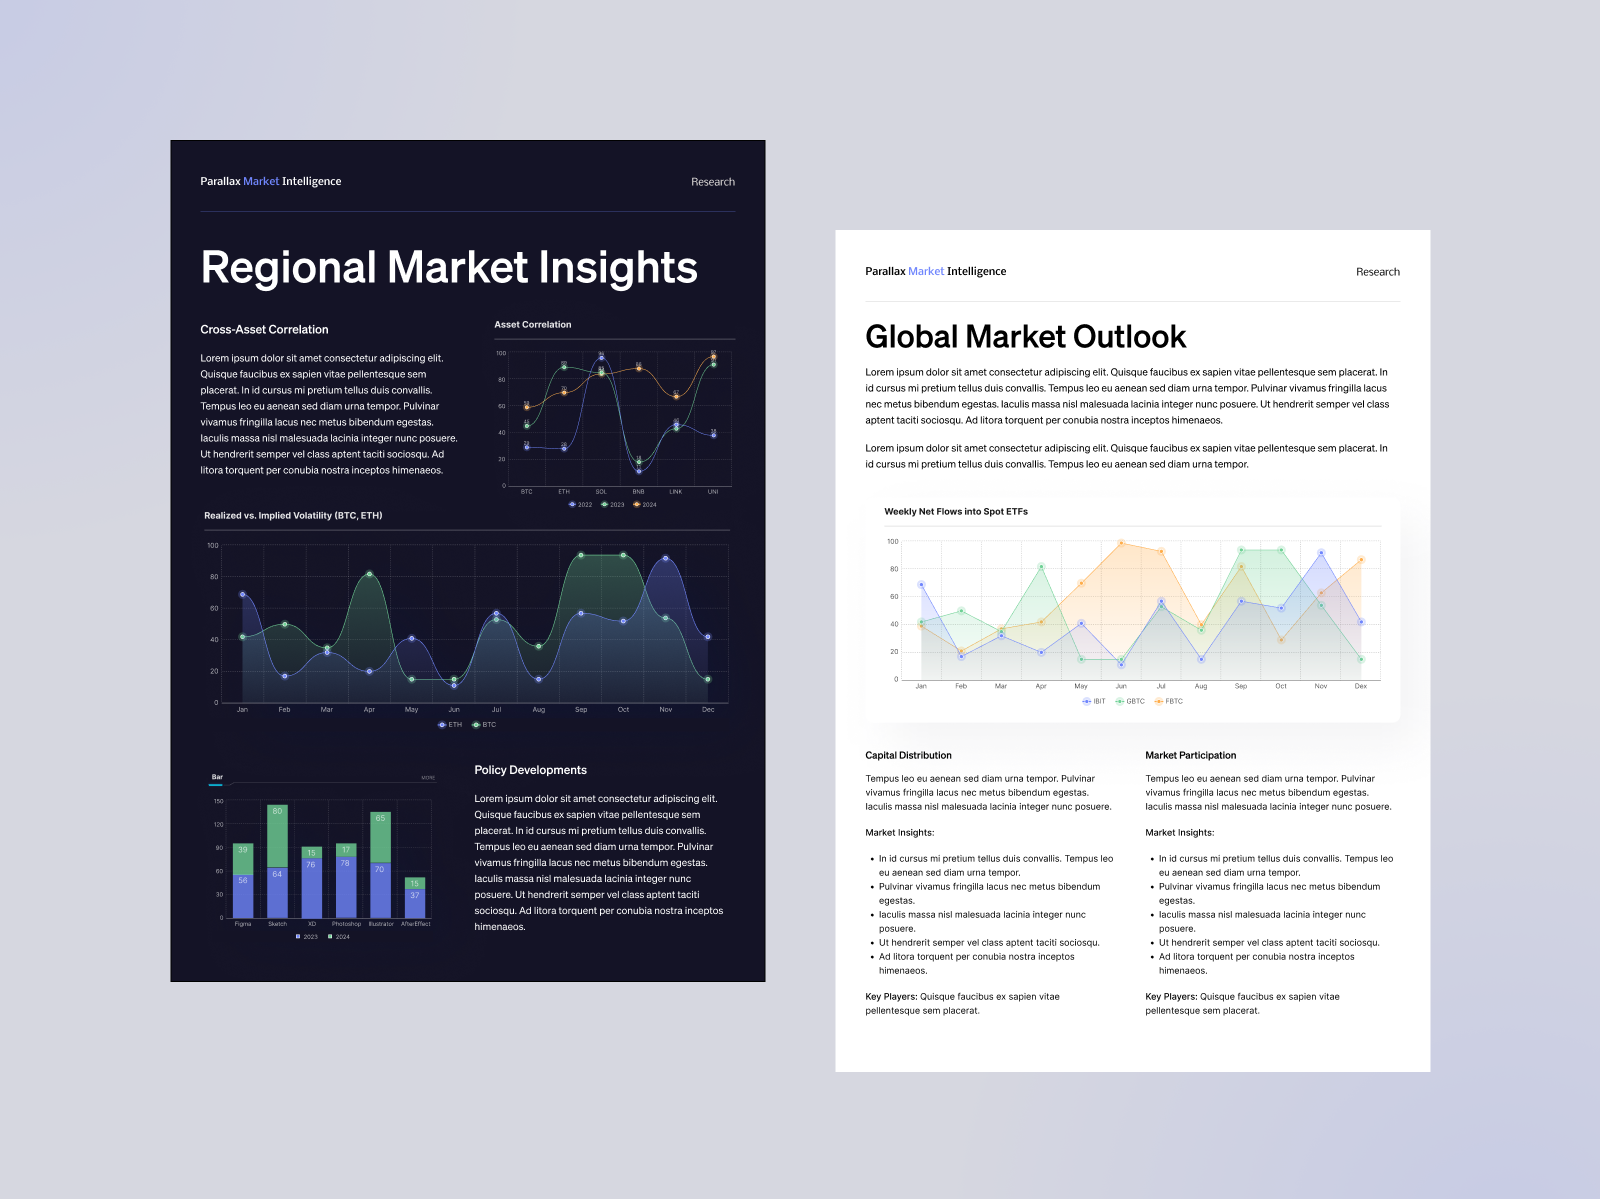
Multivariate Correlation Networks & Volatility Indices
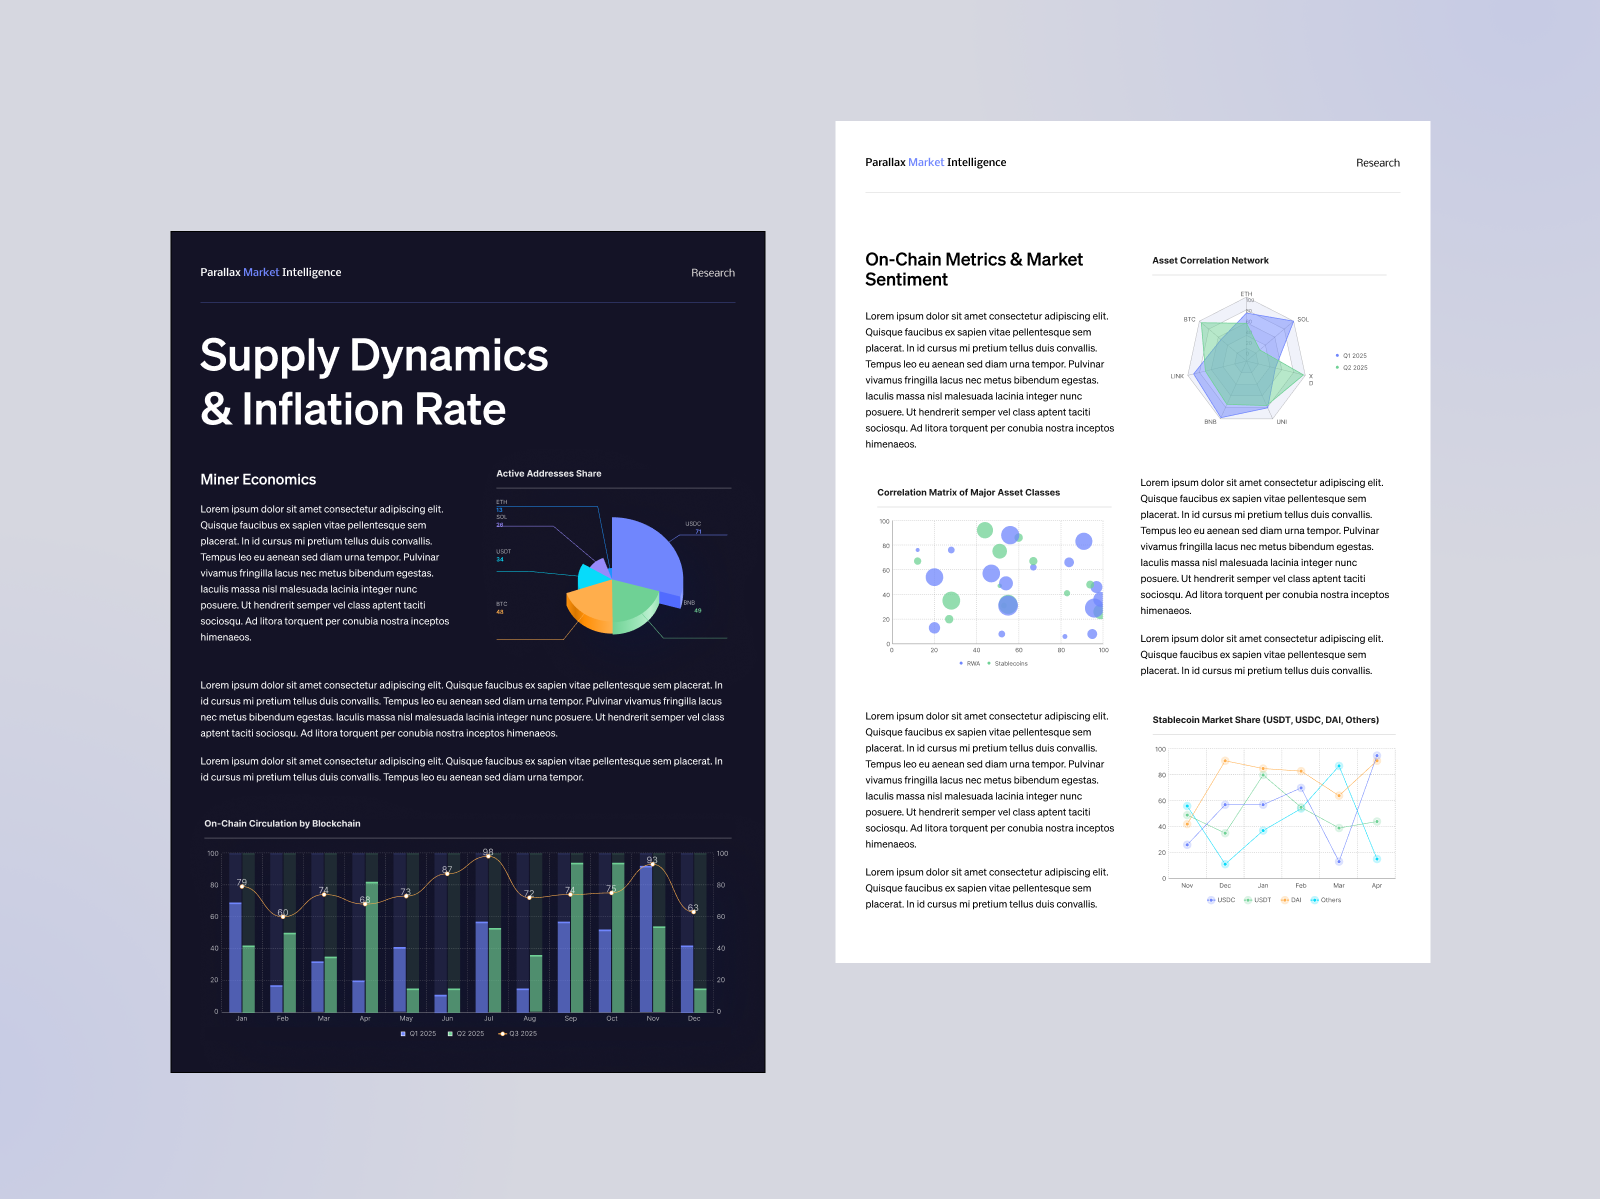
Advanced mathematical model templates. Visualizations translate high-order asset covariance, implied-versus-realized volatility bands, and crypto-to-S&P 500 macro decoupling into high-legibility executive spreads.
6-Axis Spider Network & Covariance Matrices
Understanding whether top digital assets (BTC, ETH, SOL, LINK, UNI) are moving in tandem or decoupling into idiosyncratic risk regimes requires a multivariate radar diagram. Comparing Q1 against Q2 polygonal footprints allows risk committees to identify portfolio diversification opportunities at a glance.
Weekly Net Flows Across Spot ETF Vehicles
With the launch of spot exchange-traded funds, institutional capital shifts between vehicles such as IBIT, GBTC, and FBTC dictate market liquidity. Fluid multi-line filled ribbons visualize weekly net creations and redemptions, highlighting institutional accumulation waves.
Volatility Index Construction & Multi-Year Ramps
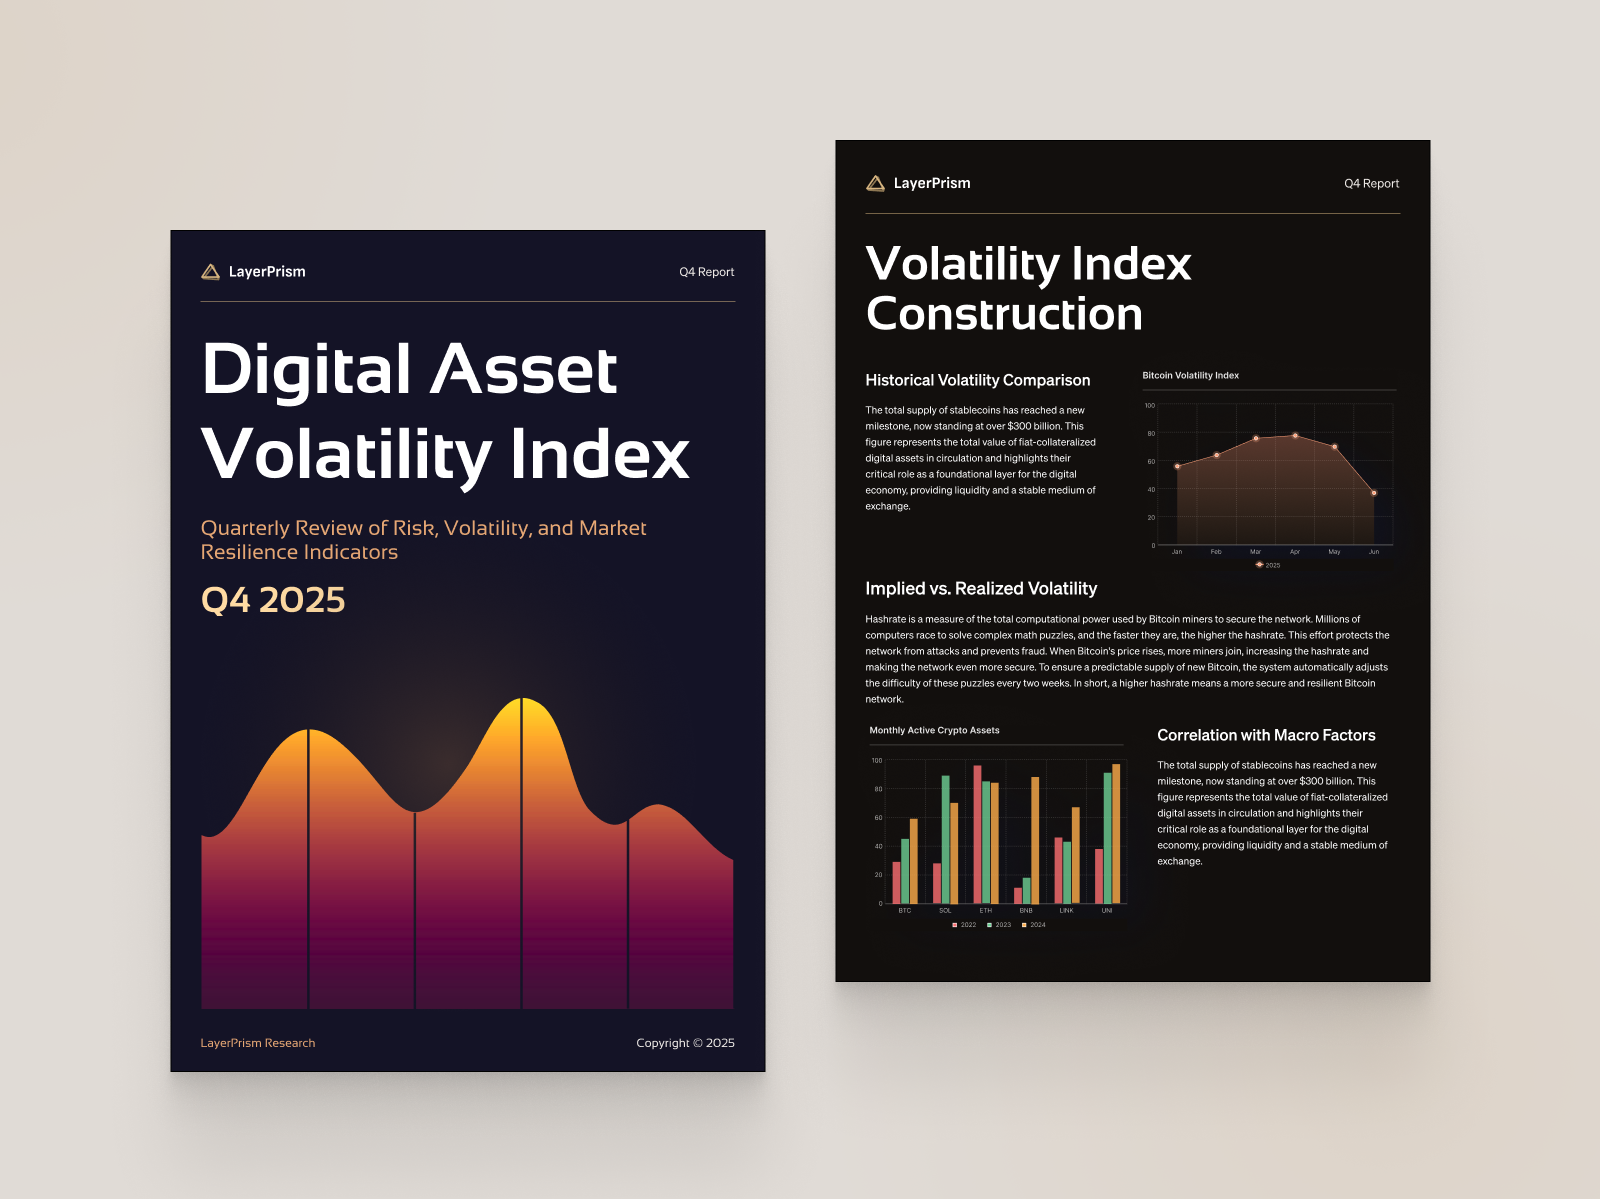
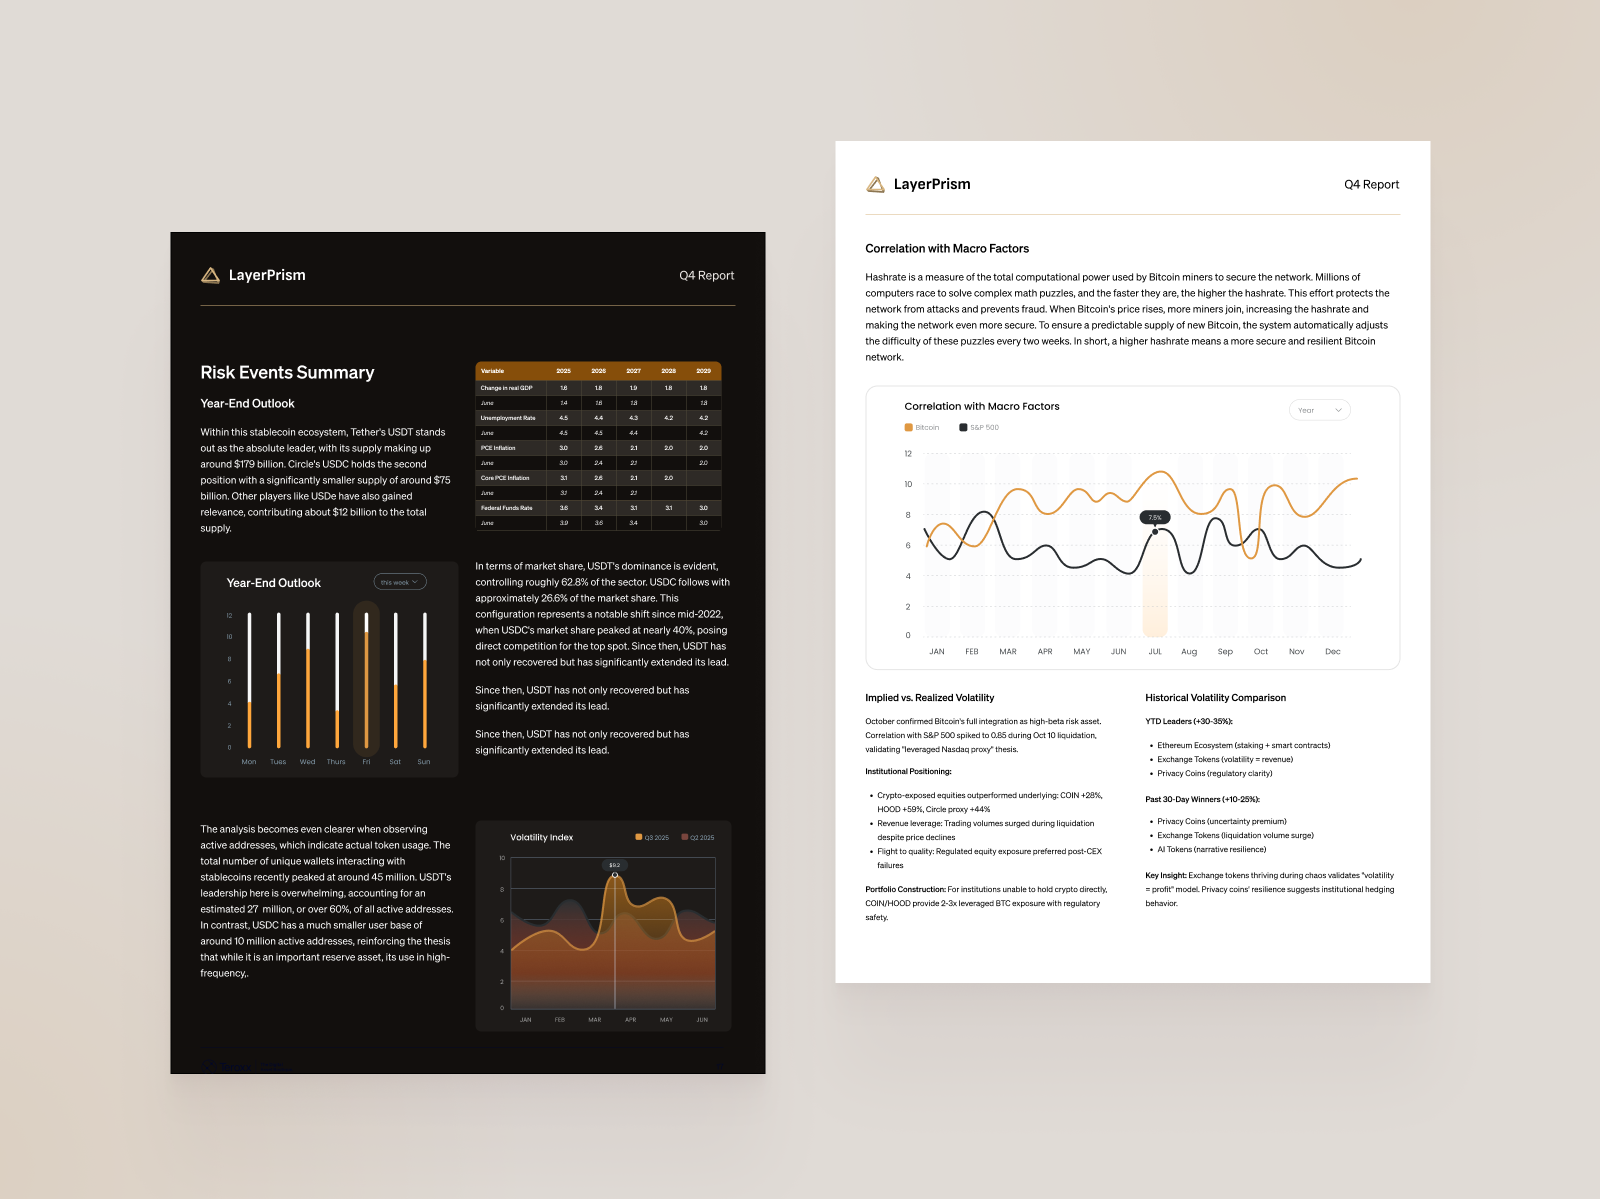
The Digital Asset Volatility Index (DAVI) utilizes calibrated vertical gradients to establish risk thresholds without visual harshness. Warm amber-to-crimson spectrum fills visually demarcate high-volatility regime shifts from calm consolidation channels, allowing risk managers to size derivative hedges accurately.
Bitcoin vs S&P 500 Correlation & Divergence
Institutional traders treat Bitcoin as a high-beta proxy during liquidity expansion while seeking non-correlated protection during sovereign debt crises. The synchronized dual-axis layout isolates periods of sharp equity-crypto coupling, backed by callout chips detailing the exact correlation coefficient.
Decentralized Protocol Revenues & Tier-1 Exchange Liquidity
Quarterly industry report templates. Spreads benchmark protocol fee capture against centralized order books, displaying liquidity depth, derivative market share, and macroeconomic forecast matrices.
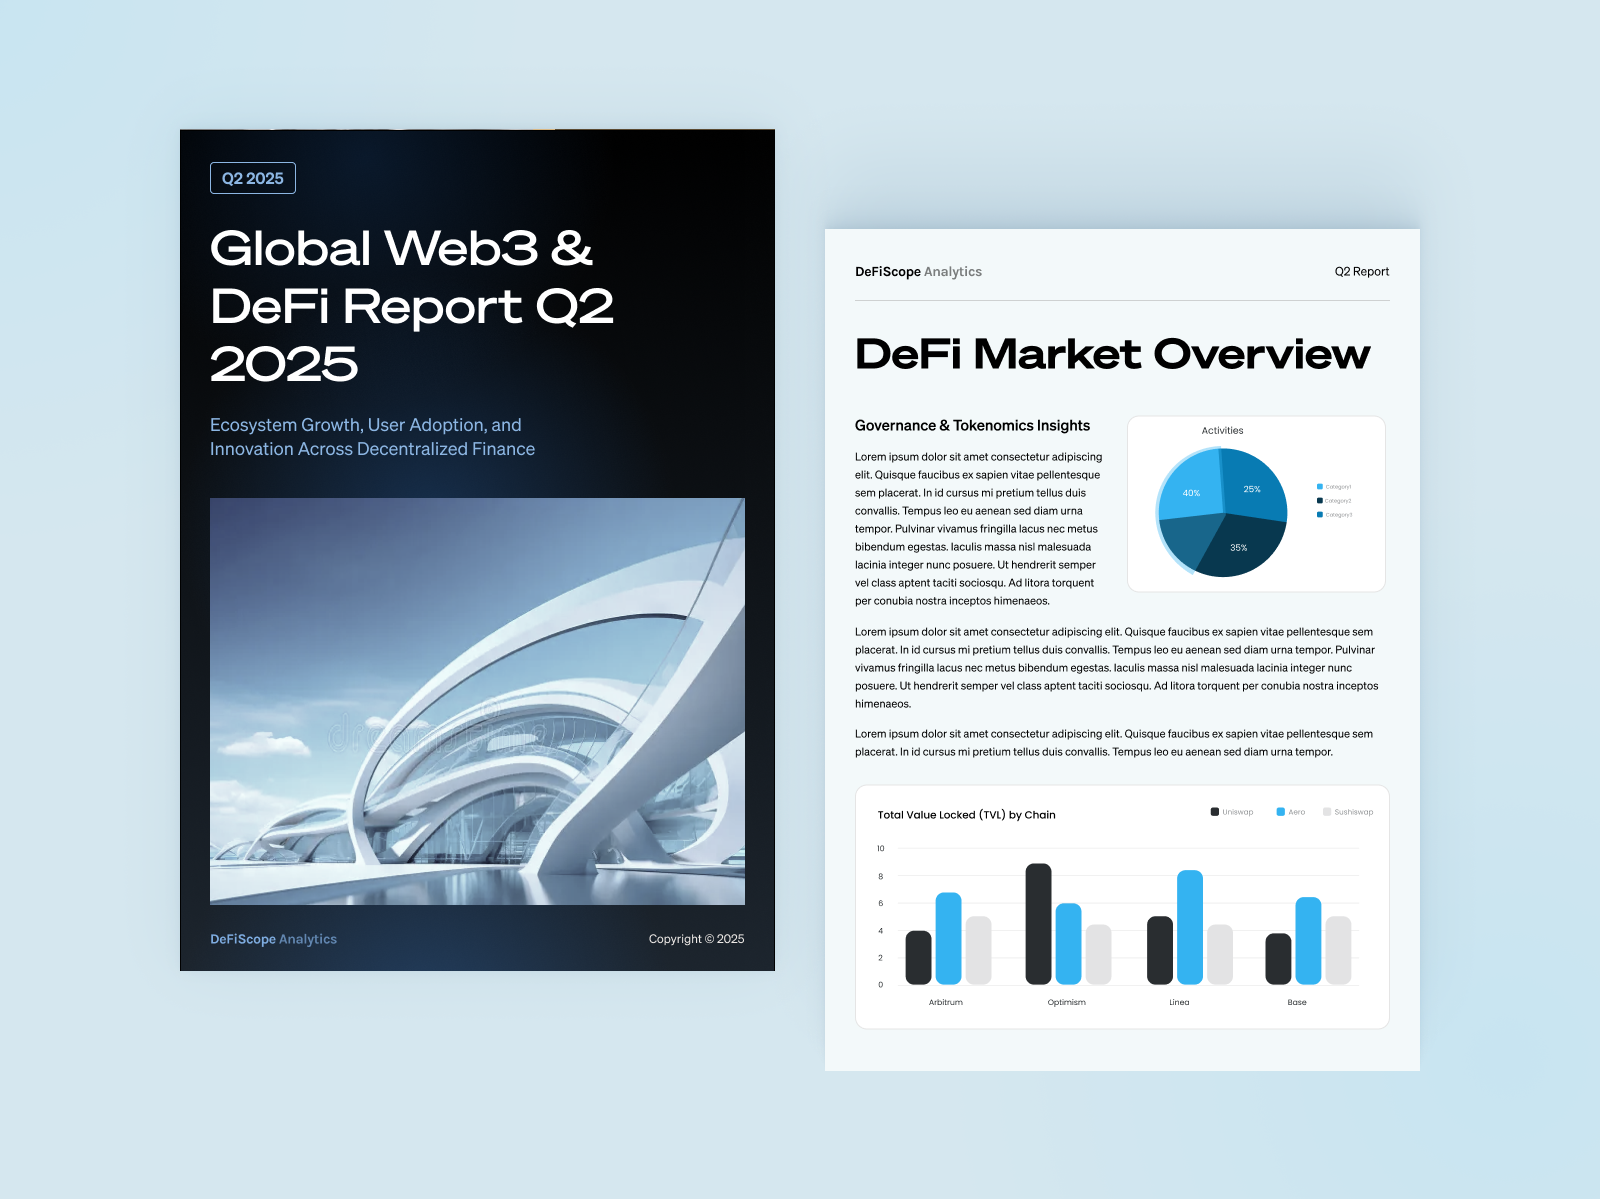
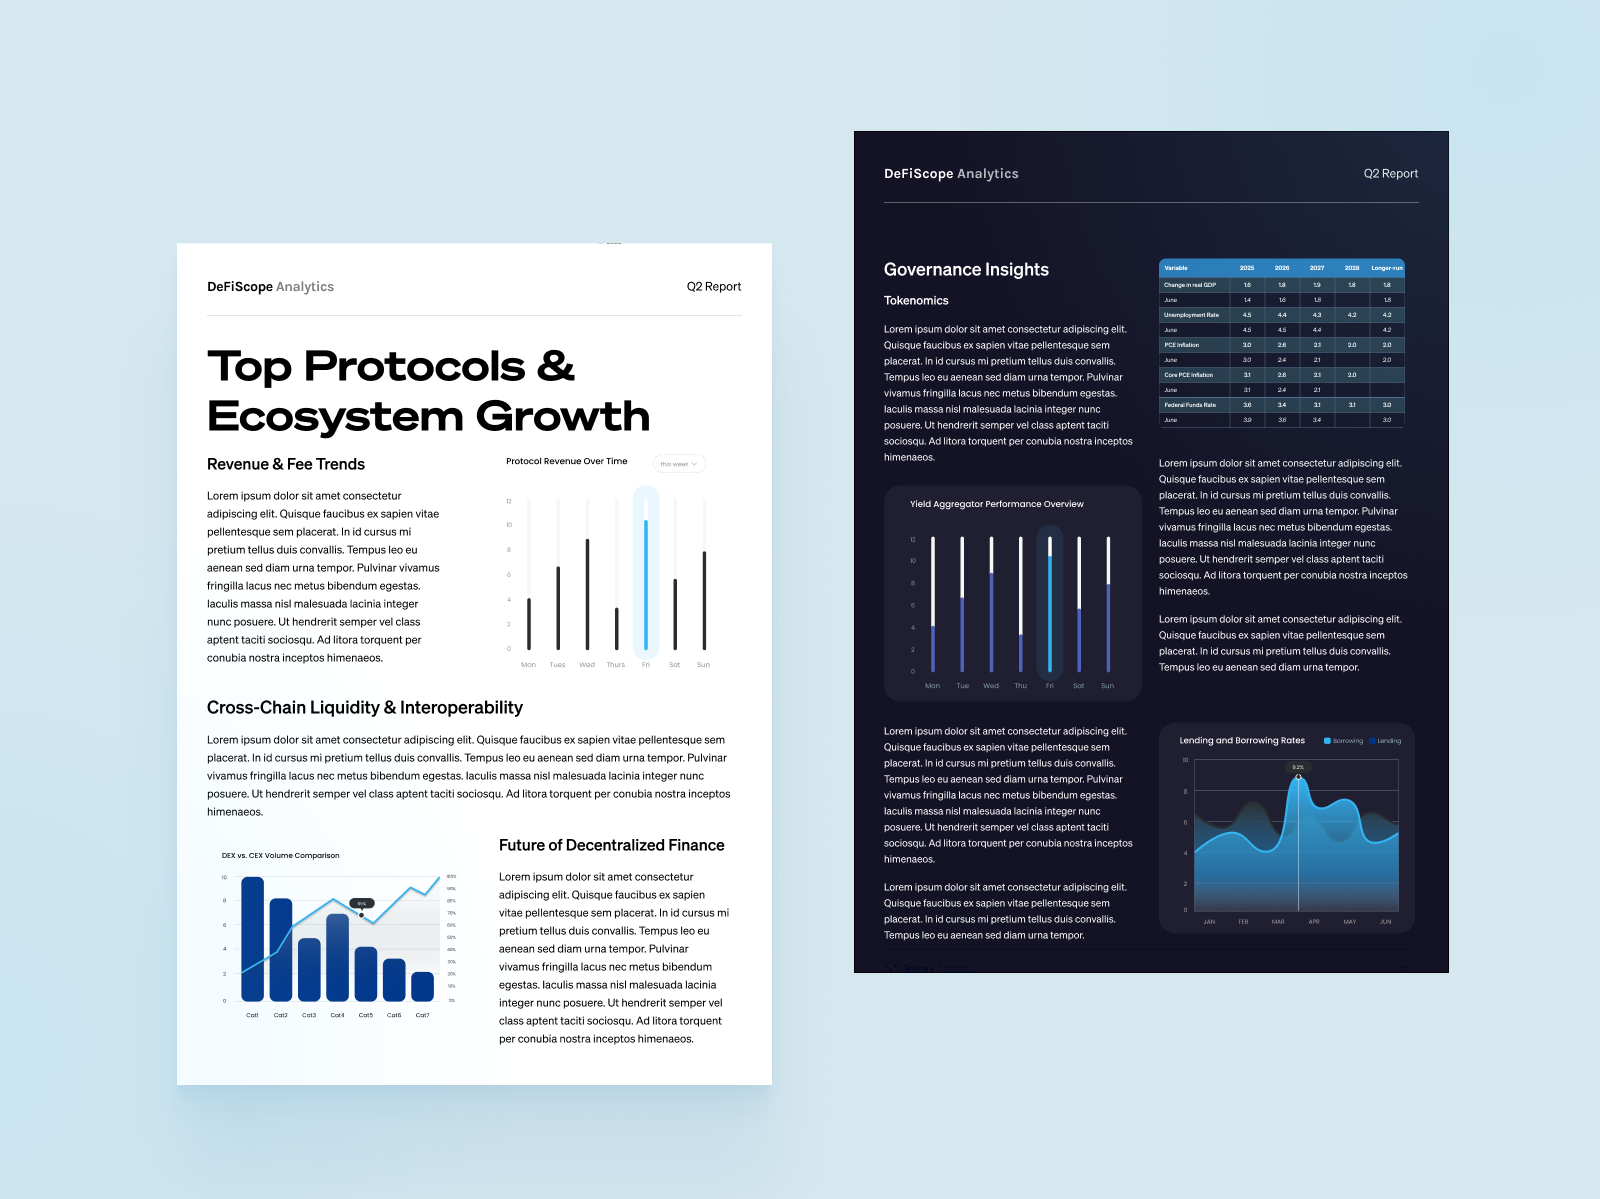
Protocol Fee & Revenue Generation Tracking
Modern DeFi protocols generate tangible cash flows via swap fees and borrowing spreads. The visual layout deploys high-contrast vertical revenue telemetry bars with active day callout pills, demonstrating genuine economic sustainability beyond token emission incentives.
Four-Year Quantitative Macroeconomic Matrix
A multi-year forecast matrix synthesizes Federal Reserve baseline estimates for real GDP, unemployment, core PCE inflation, and target policy rates across 2025 to 2028. Alternating row shading and crisp column alignment provide rapid cognitive absorption for institutional risk committees.
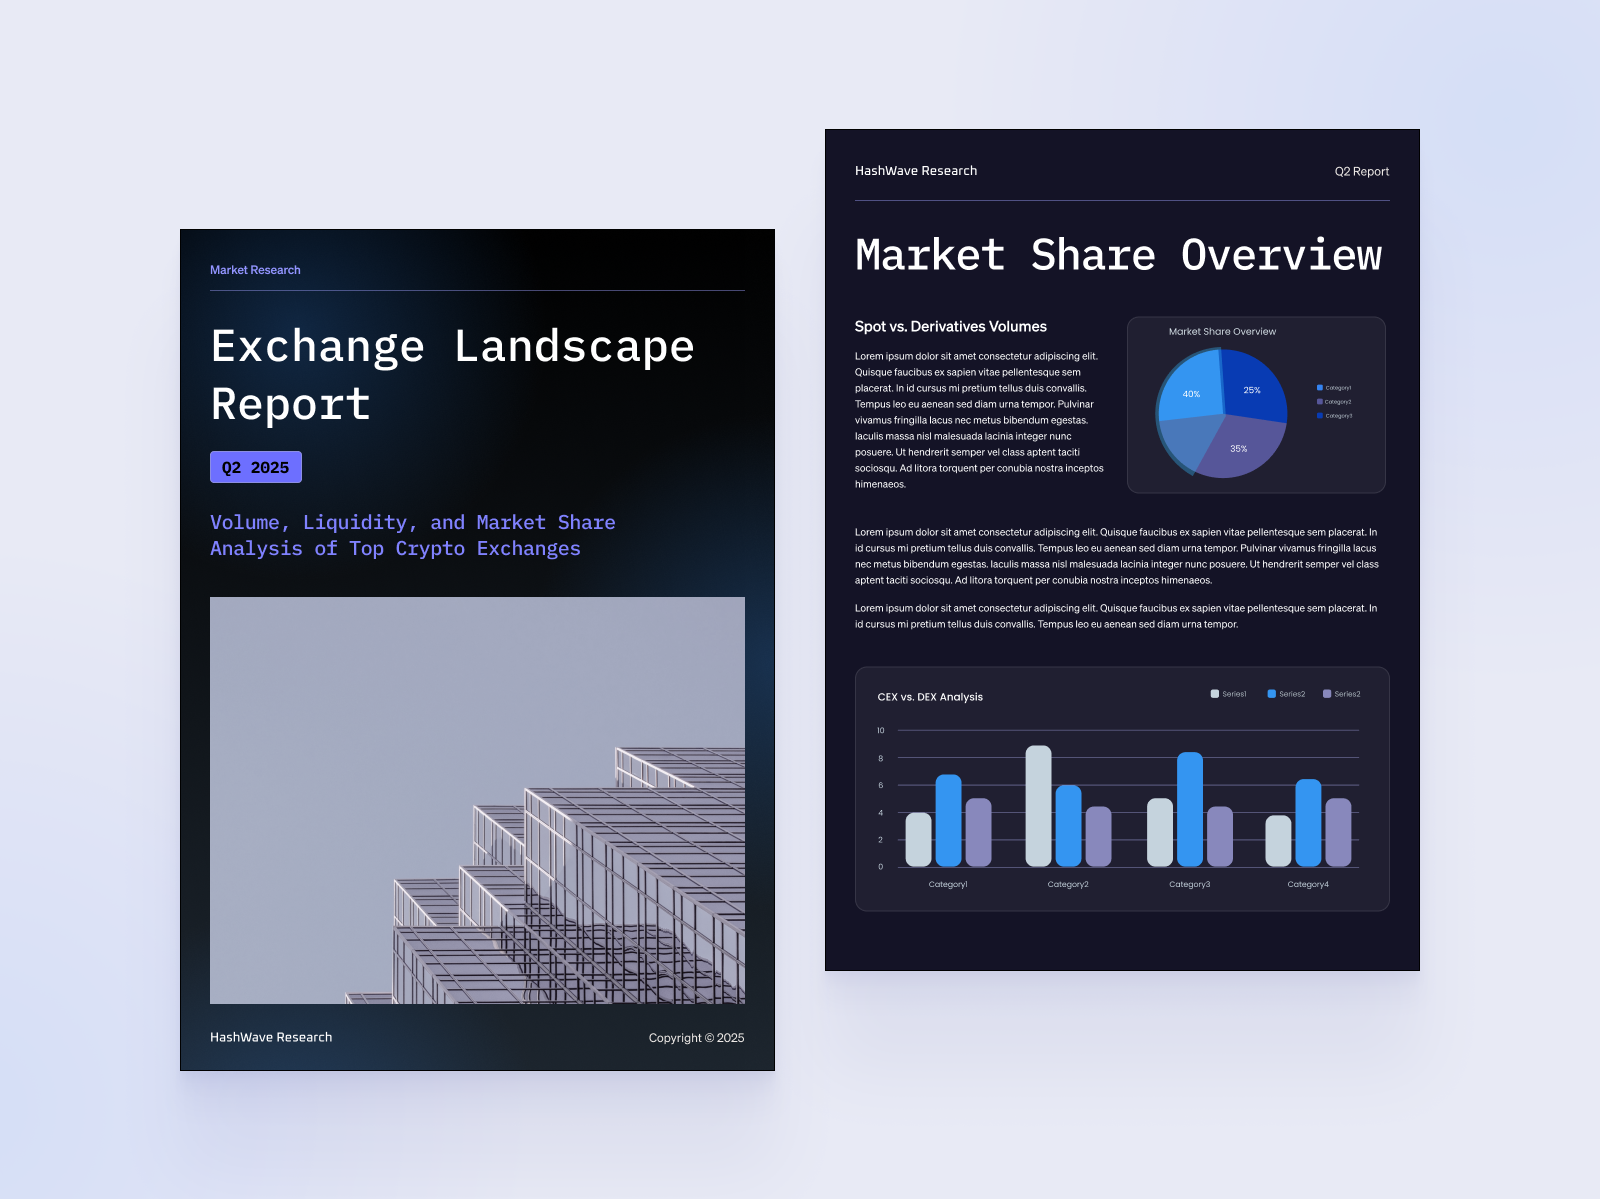
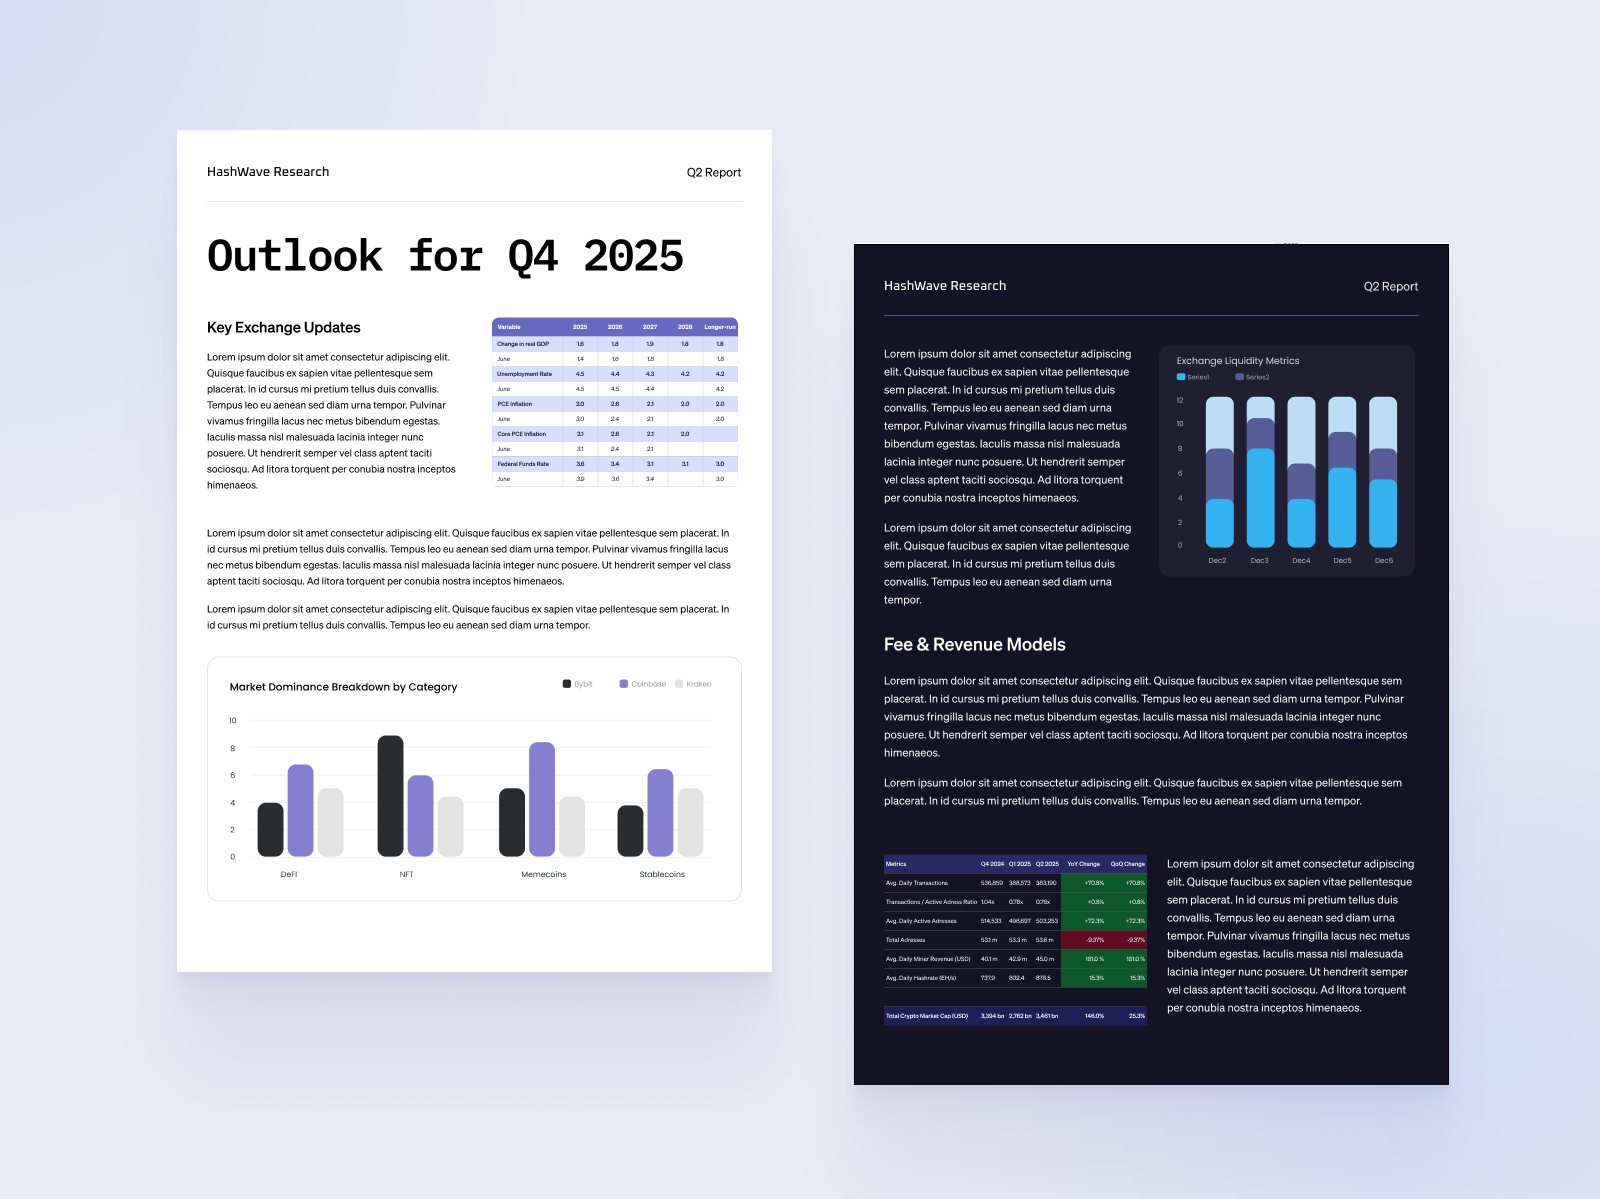
Liquidity Depth Cards Across Major Exchanges
Comparing two percent market depth across major spot and derivative exchanges requires visual encapsulation. Individual rounded liquidity cards with segmented bar meters allow OTC desk managers to evaluate execution slippage across multiple venues in seconds.
High-Density Tabular Financial Summaries
The exchange performance table incorporates green and neutral delta chips to track average daily transaction volumes, miner revenue, and aggregate network market capitalization across quarterly periods. Clean numbers maintain strict column alignment across billions in volume.
Report Design System
Practical visual rules for colors, typography, tables, and charts to keep every report clear and consistent.
Functional Financial Colors
Dark navy is used for headers and structural dividers. Green and red are reserved strictly for positive and negative financial performance. Chart lines use calm blues and neutral grays so readers can focus directly on trends without visual distractions.
Hierarchy & Number Alignment
Classic serif headings give each report a professional editorial feel, while sans-serif body text ensures high legibility. Table numbers are formatted so decimals, commas, and percentages line up vertically, allowing fast comparison down each column.
Purpose-Built Data Graphics
Each chart type matches the data it presents: line charts for price and volatility over time, bar charts for volume comparisons, and spider charts for asset correlation. Background grids stay faint so the actual data curves remain the focal point.
Print & PDF Distribution
Every template is set up to export cleanly into multi-page PDF executive briefs, board presentation decks, and physical print handouts, maintaining crisp vector graphics and legible text across all screen sizes and resolutions.
Measurable Impact on Institutional Communication
The visual communication systems elevated quantitative research credibility, accelerated executive decision-making, and established benchmark reporting standards across the digital asset industry.
Engineered across institutional research suites covering TradFi macro, venture flows, volatility, and exchange liquidity.
Custom data graphics including polar areas, radar spider networks, combo dual-axis curves, and multi-tier stacked flows.
Production-ready templates calibrated for multi-page executive PDF distribution and board presentations.
Decks and reports deployed across family office allocation meetings, institutional investor memos, and board presentations.
Full Report Archive
All 16 high-resolution financial report publications and quantitative data visualization layouts. Click any sheet to inspect in full resolution: